Not wrapping the pdf in an ImageObject() will keep the vectors.
newPage()
image('some.pdf', (0,0))
Not wrapping the pdf in an ImageObject() will keep the vectors.
newPage()
image('some.pdf', (0,0))
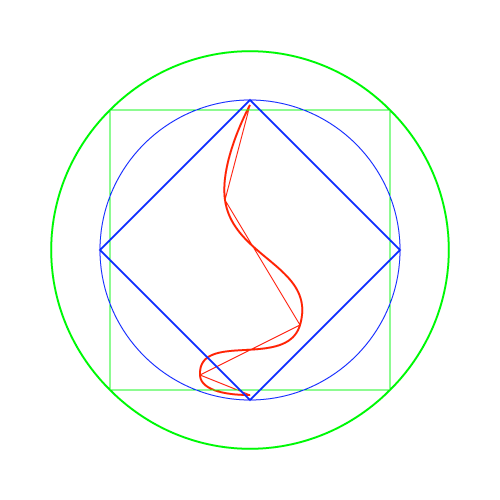
The code responsible for the rounding of the paths in a small animation I made.
DEBUG = False

# A path has points.
# A point has only an anchor [(x,y)], or has an anchor and in and out point [(x,y), (x,y), (x,y)].
# To close a path, repeat the first point at the last position.
jagged_line =[[(500,210)], [(400,250)], [(600,350)], [(450,600)], [(500,790)]]
rectangle =[[(220,220)], [(780,220)], [(780,780)], [(220,780)], [(220,220)]]
circle = [[(500.0, 800.0), (335.0, 800.0), (665.0, 800.0)], [(800.0, 500.0), (800.0, 665.0), (800.0, 335.0)], [(500.0, 200.0), (665.0, 200.0), (335.0, 200.0)], [(200.0, 500.0), (200.0, 335.0), (200.0, 665.0)], [(500.0, 800.0), (335.0, 800.0), (665.0, 800.0)]]


def draw(path):
    bez = BezierPath()
    bez.moveTo(path[0][0])
    for i in range(1, len(path)):
        p0 = path[i-1]
        p1 = path[i]
        if len(p0) == 1 and len(p1) == 1:
            # straight line between points
            bez.lineTo(p1[0])
        elif len(p0) == 3 and len(p1) == 1:
            # from curve point to straight point
            bez.curveTo(p0[2], p1[0], p1[0])
        elif len(p0) == 1 and len(p1) == 3:
            # from straight point to curve point
            bez.curveTo(p0[0], p1[1], p1[0])
        elif len(p0) == 3 and len(p1) == 3:
            # curve point on both sides
            bez.curveTo(p0[2], p1[1], p1[0])
    if path[-1] == path[0]:
        bez.closePath()
    drawPath(bez)


def round_corners(path, roundness):
    if len(path) > 2:
        new_path = []
        new_path.append(path[0])
        new_path.append(path[1])
        for i in range(1, len(path) - 1):
            p1 = new_path[i - 1]
            p2 = path[i]
            p3 = path[i + 1]
            p1, p2, p3 = round_segment(p1, p2, p3, roundness)
            new_path[i - 1] = p1
            new_path[i] = p2
            new_path.append(p3)
        # If the path is closed, we need (the handle of) the first point
        if path[-1] == path[0]:
            p1 = new_path[-2]
            p2 = path[0]
            p3 = new_path[1]
            p1, p2, p3 = round_segment(p1, p2, p3, roundness)
            new_path[-2] = p1
            new_path[-1] = p2
            new_path[0] = p2
        return new_path
    else:
        return path


def round_segment(p1, p2, p3, roundness):
    if roundable(p1, p2, p3):
        p2_in, p2_out = create_handles(p1[0], p2[0], p3[0], roundness)
        p2 = [p2[0], p2_in, p2_out]
    return p1, p2, p3


def roundable(p1, p2, p3):
    # If two of the three points are in the same spot,
    # we can’t calculate a curve between two points.
    p1_anchor = p1[0]
    p2_anchor = p2[0]
    p3_anchor = p3[0]
    d12 = distance_between(p1_anchor, p2_anchor)
    d23 = distance_between(p2_anchor, p3_anchor)
    if d12 == 0 or d23 == 0:
        return False
    else:
        return True


def create_handles(A, B, C, smoothness):
    # A is the point before point B
    # B is the point to create the handles for
    # C is the point after point B
    d_AB = distance_between(A, B)
    d_BC = distance_between(B, C)
    # Create an isosceles triangle A, B, p4 based on triangle A, B, C.
    # Side B, p4 is the same length as side A, B.
    # Side B, p4 has the same direction as side B, C
    p4_x = ((C[0] - B[0]) * (d_AB / d_BC)) + B[0]
    p4_y = ((C[1] - B[1]) * (d_AB / d_BC)) + B[1]
    p4 = (p4_x, p4_y)

    if DEBUG:
        draw_handle(B, p4)

    # Calculate a point p5 on the base of the isosceles triangle,
    # exactly in between A and B.
    p5_x = A[0] + ((p4[0] - A[0]) / 2)
    p5_y = A[1] + ((p4[1] - A[1]) / 2)
    p5 = (p5_x, p5_y)

    if DEBUG:
        draw_point(p5, 10)
        draw_line(A, p4)

    # The line from the top of the isosceles triangle B to
    # the point p5 on the base of that triangle
    # divides the corner p1, p2, p3 in two equal parts

    if DEBUG:
        draw_line(B, p5)

    # Direction of the handles is perpendicular
    vx = p5[0] - B[0]
    vy = p5[1] - B[1]
    handle_vx = 0
    handle_vy = 0
    if vx == 0 and vy == 0:
        # The three points are on one line, so there will never be a curve.
        pass
    elif vx == 0:
        # prevent a possible division by 0
        handle_vx = 1
        handle_vy = 0
    elif vy == 0:
        # prevent a possible division by 0
        handle_vx = 0
        handle_vy = 1
    elif abs(vx) < abs(vy):
        handle_vx = 1
        handle_vy = vx / vy
    else:
        handle_vx = vy / vx
        handle_vy = 1

    # Define handles
    handle_a = (B[0] + handle_vx, B[1] - handle_vy)
    handle_b = (B[0] - handle_vx, B[1] + handle_vy)

    # The handle closest to point A will be the incoming handle of point B
    d_ha_A = distance_between(A, handle_a)
    d_hb_A = distance_between(A, handle_b)

    # I have to make this better. Also, where’s that 0.8 coming from? What was I thinking?
    incoming_handle_lenght = d_AB * smoothness
    outgoing_handle_length = d_BC * smoothness
    total_handle_length = incoming_handle_lenght + outgoing_handle_length
    max_handle_length = 0.8 * total_handle_length
    if incoming_handle_lenght > max_handle_length:
        outgoing_handle_length += incoming_handle_lenght - max_handle_length
        incoming_handle_lenght = max_handle_length
    if outgoing_handle_length > max_handle_length:
        incoming_handle_lenght += outgoing_handle_length - max_handle_length
        outgoing_handle_length = max_handle_length

    # finally, the in and out points
    if d_ha_A < d_hb_A:
        B_incoming = (B[0] + handle_vx * incoming_handle_lenght, B[1] - handle_vy * incoming_handle_lenght)
        B_outgoing = (B[0] - handle_vx * outgoing_handle_length, B[1] + handle_vy * outgoing_handle_length)
    else:
        B_incoming = (B[0] - handle_vx * incoming_handle_lenght, B[1] + handle_vy * incoming_handle_lenght)
        B_outgoing = (B[0] + handle_vx * outgoing_handle_length, B[1] - handle_vy * outgoing_handle_length)

    if DEBUG:
        draw_point(B_incoming, 6)
        draw_point(B_outgoing, 6)
        draw_line(B, B_incoming)
        draw_line(B, B_outgoing)
        draw_line(A, B)

    return B_incoming, B_outgoing


def distance_between(p1, p2):
    dx = p2[0] - p1[0]
    dy = p2[1] - p1[1]
    return pow((dx * dx + dy * dy), 0.5)


def draw_point(point, size):
    with savedState():
        fill(0, 0.7, 1)
        stroke(None)
        oval(point[0] - 0.5 * size, point[1] - 0.5 * size, size, size)


def draw_line(a, b):
    with savedState():
        fill(None)
        strokeWidth(1)
        stroke(0, 0.7, 1)
        line((100, 100), (900, 900))
        line(a, b)


def draw_handle(p, h):
    draw_point(p, 9)
    draw_line(p, h)


fill(None)

# Drawing the original shape and the rounded shape, slightly thicker.
stroke(1, 0, 0)
strokeWidth(2)
draw(jagged_line)
rounded_line = round_corners(jagged_line, 0.4)
strokeWidth(4)
draw(rounded_line)

# A rounding of 0.28 seems to get me as close to a circle as I can get.
stroke(0, 1, 0)
strokeWidth(2)
draw(rectangle)
rounded_rectangle = round_corners(rectangle, 0.28)
strokeWidth(4)
draw(rounded_rectangle)

# Rounding an oval by zero results in a rhombus.
stroke(0, 0, 1)
strokeWidth(2)
draw(circle)
rounded_circle = round_corners(circle, 0)
strokeWidth(4)
draw(rounded_circle)
@rohernandezz You don’t have ~/Library/Preferences/com.drawbot.plist ?
I don’t believe it’s possible with DrawBot’s Variables.
It might be possible to use DrawBot with Vanilla and create your own interface, but I have no first hand experience with that.
Also, the example script on that page does only work for me if I add this at the top:
from PyObjCTools import AppHelper
and this at the bottom:
AppHelper.runEventLoop()
areaAverage() does not return anything, but changes the imageObject.
p = 'schrofer_head.jpg'

im = ImageObject(p)
print(im.size()) # (1365.0, 1365.0)

im.areaAverage()
print(im.size()) # (1.0, 1.0)

print(imagePixelColor(im, (0, 0))) # (0.6, 0.6039215686274509, 0.6, 1.0)
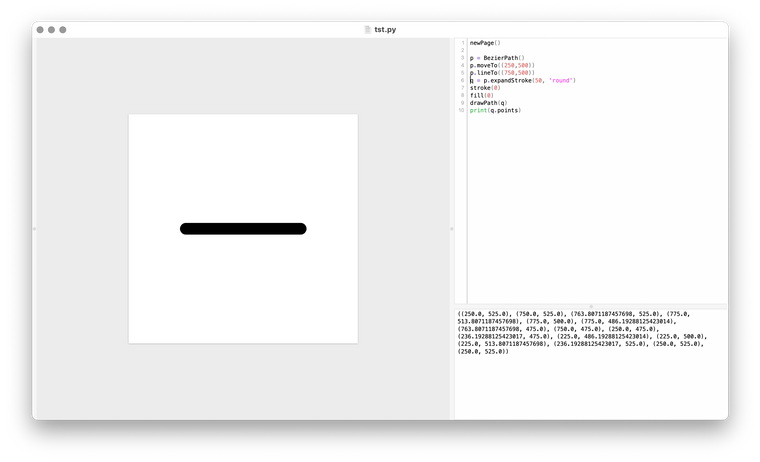
Hi Maurice, expandStroke() returns a path.
Almost the same code, but instead of drawing a grid we draw 1000 circles randomly. As they have to stay in the same place, we save their locations in an array.
(Also in this script some nice code to have if you want to publish animated gifs; a way to reduce the colours in the gif.)
import random
import struct

frames = 24
page_size = 1000
number_of_circles = 1000
min_dot_size = 10
max_dot_size = 70
radius = 200


# create color table for gif
# https://stackoverflow.com/questions/6269765/what-does-the-b-character-do-in-front-of-a-string-literal
table = b""
greys = [0,85,170,255]
for i in greys:
    r = struct.pack(">B", i)
    g = struct.pack(">B", i)
    b = struct.pack(">B", i)
    table += r + g + b # + a


def draw_dot(center, diameter):
    x = center[0] - diameter / 2
    y = center[1] - diameter / 2
    oval(x, y, diameter, diameter)


# Generate circles, randomly distributed
circles = []
for i in range(number_of_circles):
    x = random.randint(0,page_size)
    y = random.randint(0,page_size)
    circles.append((x,y))


for f in range(frames):
    percentage_animated = f / frames
    newPage()

    fill(0)
    rect(0, 0, page_size, page_size)

    for c in circles:
        x = c[0]
        y = c[1]
        distance = pow( (pow(x - page_size / 2, 2 ) + pow(y - page_size / 2, 2)), 0.5)
        distance = distance - percentage_animated * radius * 2
        distance = distance % (radius * 2)
        percentage = distance / radius
        if percentage > 1:
            percentage = 2 - percentage
        dot_size = min_dot_size + percentage * (max_dot_size - min_dot_size)
        fill(None)
        stroke(1)
        draw_dot((x,y), dot_size)

saveImage("animated.gif", imageGIFRGBColorTable = table)
frames = 24
page_size = 1000
grid_size = 20
grid_spacing = page_size / grid_size
min_dot_size = 10
max_dot_size = 50
radius = 100

def draw_dot(center, diameter):
    x = center[0] - diameter / 2
    y = center[1] - diameter / 2
    oval(x, y, diameter, diameter)

for f in range(frames):
    percentage_animated = f / frames
    newPage()

    fill(0)
    rect(0, 0, page_size, page_size)

    for row in range(grid_size):
        for column in range(grid_size):
            x = row * grid_spacing + grid_spacing / 2
            y = column * grid_spacing + grid_spacing / 2
            # Calculate distance from (x,y) of the dot to the center of the page
            distance = pow( (pow(x - page_size / 2, 2 ) + pow(y - page_size / 2, 2)), 0.5)
            # The wave must seem to move, so for every frame in the
            # animation, add a precentage of the length of the wave.
            # Add or substract to change direction.
            distance = distance - percentage_animated * radius * 2
            # Use modulo to get a distance between 0 and double the radius
            distance = distance % (radius * 2)
            # The wave has a lenghth of double the radius. In the
            # first halve of the lenght, the dots get larger, in the
            # second halve the dots get smaller.
            # So, we calculate a percentage between 0 and 2, and when
            # the percentage is larger than 1, we count backwards.
            percentage = distance / radius
            if percentage > 1:
                percentage = 2 - percentage
            dot_size = min_dot_size + percentage * (max_dot_size - min_dot_size)
            fill(1)
            draw_dot((x,y), dot_size)

saveImage("animated.gif")
You could combine that with bitmapFont-Drawbot.py from Connor Davenport, which will give you something like this:
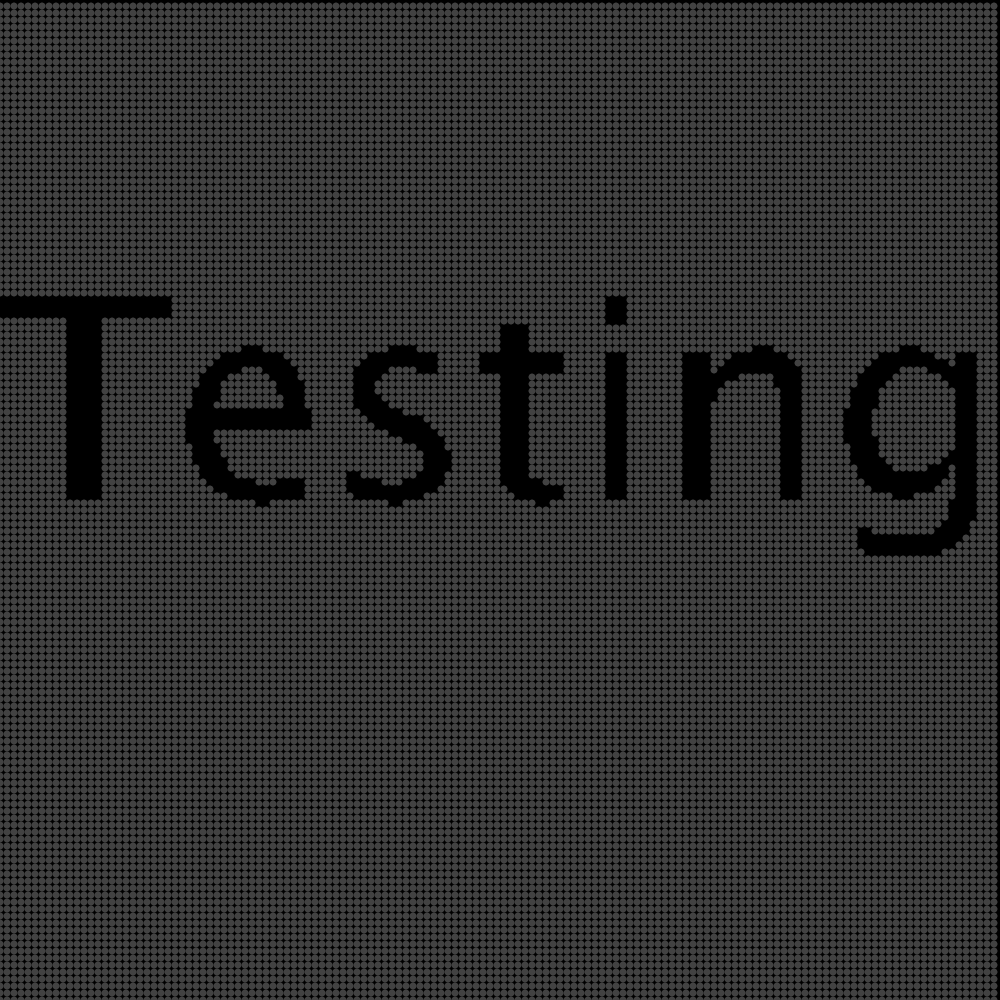
Do you mean something like this?
w = 1920
h = 1080
columns = 13
spacing = w/(columns+1)
fs = 60
duration = .25
txt = 'ABCD'
frames = columns+len(txt)+1


for frame in range(frames):
    newPage(w, h)
    frameDuration(duration)
    fontSize(fs)
    # white background
    with savedState():
        fill(1)
        rect(0,0,w,h)
    for column in range(columns):
        x = spacing + column * spacing
        # Use the frame count as starting position for the text.
        # frame-len(txt) makes sure the start of the text is outside the row of characters
        if column >= frame-len(txt) and column < frame:
            # txt[0] gets the first character, A, txt[1] gets the second, etc.
            # txt[column-frame] makes sure the range alway stays between 0 and the length of the text,
            # as the length of frames is defined by columns+len(txt)+1.
            text(txt[column-frame], (x, h/2), align='center')
        else:
            # If the column position is not between frame-len(txt) and frame, use a dot.
            # You could add random characters here.
            text('.', (x, h/2), align='center')

saveImage('abcd.gif')
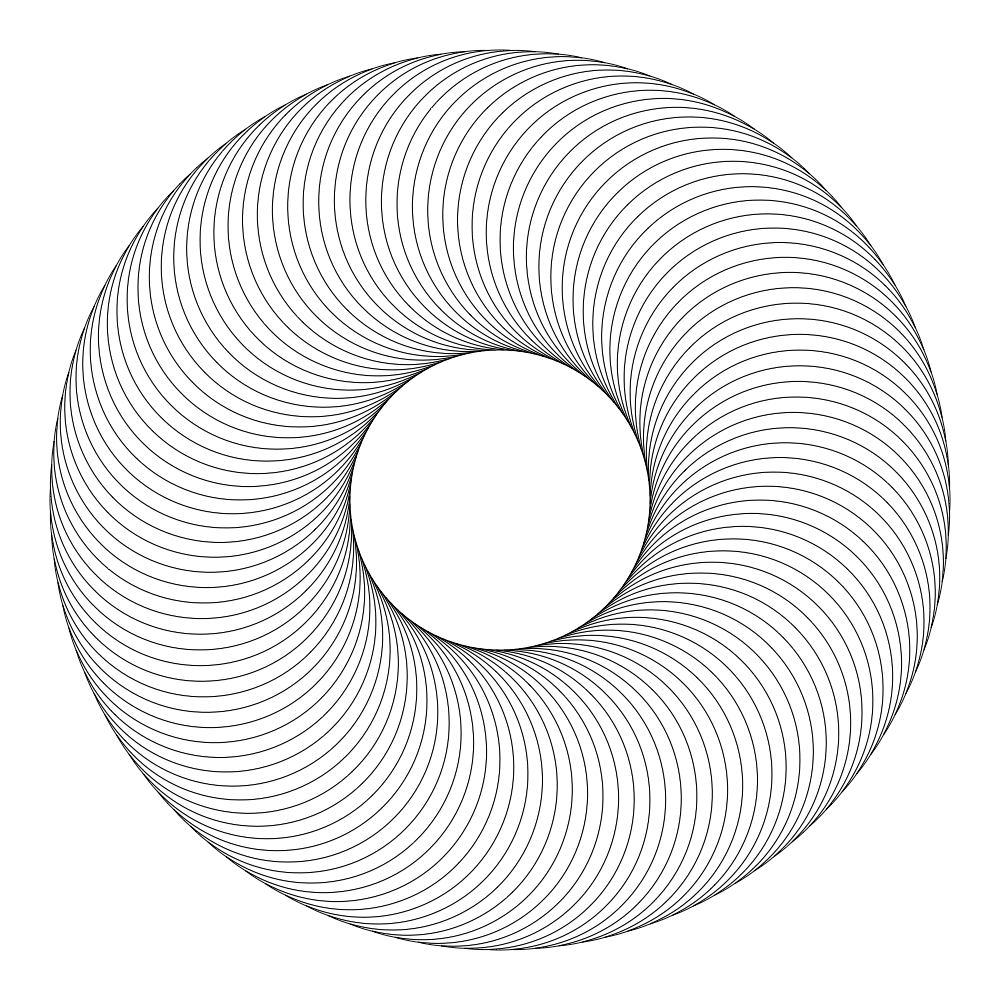
radius = 300
circle_size = 300
step = 3
x, y = 500, 500

fill(1)
stroke(0)

for d in range(0, 360, step):
    circle1 = BezierPath()
    circle1.oval(x - circle_size / 2, y - circle_size / 2, circle_size, circle_size)
    circle1.translate(0, radius)
    circle1.rotate(d, (x, y))

    circle2 = BezierPath()
    circle2.oval(x - circle_size / 2, y - circle_size / 2, circle_size, circle_size)
    circle2.translate(0, radius)
    circle2.rotate(d + step, (x, y))

    dif = circle2.difference(circle1)
    drawPath(dif)
In response to https://twitter.com/MauriceMeilleur/status/1242196482717110274