Beginner Question
-
Hi, I'm trying to do something and can't get it to work. I suspect it might be the way I'm structuring things.
I want to generate and plot images like this:
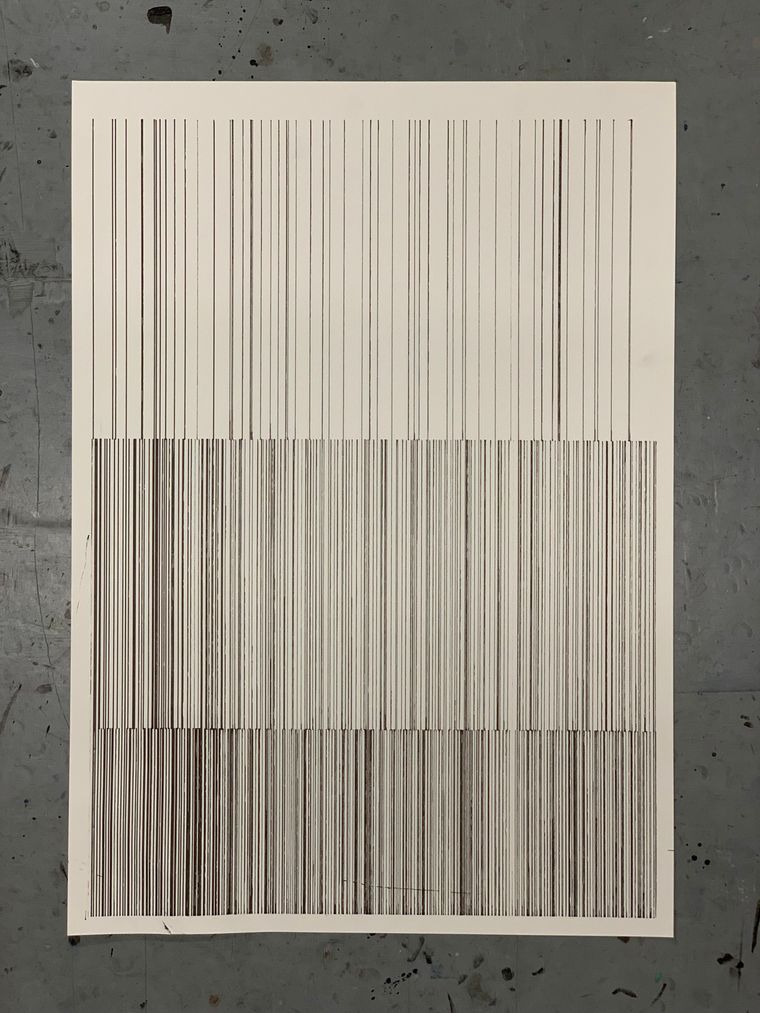
I'm trying to make bands of random lines, but when I try to make a for loop only the first band appears. Here's an example with 2 bands:
size(600, 849)


Density1 = 10
lines1 = 650

Density2 = 5
lines2 = 120

mTop = 20
mBottom = 20
mLeft = 20
mRight = 20

row1bot = 500
row1top = 849 - mTop

row2bot = row1bot
row2top = row1bot - 200


fill(None)
strokeWidth(1)
stroke(0)

for z in range(lines1):
    line((mLeft+10, row1top), (mLeft+10, row1bot))
    # and translate the canvas
    translate((randint(0, Density1)), 0)


for z in range(lines2):
    line((mLeft+10, row1bot), (mLeft+10, row1bot-100))
    # and translate the canvas
    translate((randint(0, Density2)), 0)


code_text
I'm a total beginner and would like to also figure out setting a margin. Any help gratefully received!
-
When you start with the second loop, the canvas is translated al the way outside image.
If you use savedState(), all translations you make will be reset.
size(600, 849)


Density1 = 10
lines1 = 650

Density2 = 5
lines2 = 120

mTop = 20
mBottom = 20
mLeft = 20
mRight = 20

row1bot = 500
row1top = 849 - mTop

row2bot = row1bot
row2top = row1bot - 200


fill(None)
strokeWidth(1)
stroke(0)

with savedState():
    for z in range(lines1):
        line((mLeft+10, row1top), (mLeft+10, row1bot))
        # and translate the canvas
        translate((randint(0, Density1)), 0)


with savedState():
    for z in range(lines2):
        line((mLeft+10, row1bot), (mLeft+10, row1bot-100))
        # and translate the canvas
        translate((randint(0, Density2)), 0)
-
Maybe in this case it’s easier to not use translate but just calculate the coordinates.
size(600, 849)

margin = 30
density = 10

fill(None)
strokeWidth(1)
stroke(0)

x = margin

while x < width()-margin:
    line((x,margin),(x,height()-margin))
    x += randint(0,density)

# Making sure the right margin is always 30 by
# drawing the last line on the margin
line((width()-margin,margin),(width()-margin,height()-margin))
-
@monomonnik thank you so much! Your second example looks really good. Could I use saved state to implement the bands of different line densities?
-
savedState() is just a way to change graphic properties without effecting the graphic state outside the savedState().
For example, the fill and stroke changes inside the savedState() aren’t reflected in the line that is drawn later.
fill(None)
strokeWidth(10)
stroke(0)

with savedState():
    fill(1,0,0)
    stroke(None)
    rect(0,0,.5*width(),height())

line((.75*width(),0),(.75*width(),height()))
So yes, you could draw three bands, and use translate to position them.
for i in range(3):
    with savedState():
        fill(random())
        translate(0, i/3*height())
        rect(0,0,width(),1/3*height())
(In this example, the savedState() is not necessary. However, if you are going to use translate to draw the lines, it’s nice that everything resets and you restart at (0,0) in the next step of the loop)
-
@monomonnik this has been very helpful. This is getting closer to what I wanted to do:
size(600, 849)

margin = 30
density = 3

fill(None)
strokeWidth(1)
stroke(0)


x = margin

while x < width()-margin:
    line((x,margin),(x,height()-500-margin))
    x += randint(0,density)
    line((x,margin),(x,height()-600-margin))
    x += randint(0,density)
    line((x,margin),(x,height()-200-margin))
    x += randint(0,density)
    line((x,margin),(x,height()-margin))
    x += randint(0,density)
I'd still like to dynamically change the number of bands, their start/finish points and density, but this is a lot better!
Thank you
-
Just for fun, my interpretation:
size(600, 849)

margin = 30
density = [3,2,7,20,12]
rows = len(density)
row_height = (height()-2*margin) / rows

fill(None)
strokeWidth(1)
stroke(0)

for i, d in enumerate(density):
    x = margin
    y1 = margin + i*row_height
    y2 = margin + (i+1)*row_height
    while x < width()-margin:
        line((x,y1),(x,y2))
        x += randint(0,d)
-
@monomonnik Very nice!
-
thanks @monomonnik! very well explained!
the while loop at the end makes its maybe a bit unreadable...
you can use
random.sampleto generate a random list easily:import random density = 5 result = random.sample(range(0, 100), density) print(result)
-
@frederik Yes, I’m not a fan of while loops too. So, you would propose something like this?
import random

size(600, 849)

margin = 30
density = [.01, .1, .5, .9, .99] # percentage
rows = len(density)
row_width = width()-2*margin
row_height = (height()-2*margin) / rows

fill(None)
strokeWidth(1)
stroke(0)

for i, d in enumerate(density):
    y1 = margin + i*row_height
    y2 = margin + (i+1)*row_height
    total_lines = int(d * row_width)
    x_positions = random.sample(range(margin, margin+row_width), total_lines)
    for x in x_positions:
        line((x,y1),(x,y2))
-
Normally I would define a minimum and maximum distance. I wouldn’t know how to do that using random.sample().
size(600, 849)

margin = 30
# Density here is defined by minimum and maximum distance between lines
density = [[100,200],[10,60],[1,3]]
rows = len(density)
row_height = (height()-2*margin) / rows

fill(None)
strokeWidth(1)
stroke(0)

for i, d in enumerate(density):
    x = margin
    y1 = margin + i*row_height
    y2 = margin + (i+1)*row_height
    while x < width()-margin:
        line((x,y1),(x,y2))
        x += randint(d[0],d[1])
-
its all the same and very much based on coding flavours
different approach, similar result, here you know the amount of lines exactly.
import random

size(600, 849)

margin = 106
density = [3,2,7,20, 1002] # the amount of lines
rows = len(density)
row_width = width() - 2 * margin
row_height = (height() - 2 * margin) / rows

fill(None)
strokeWidth(1)
stroke(0)

for i, d in enumerate(density):
    y1 = margin + i * row_height
    y2 = y1 + row_height
    x_positions = [random.random() * row_width for _ in range(d)]
    for x in x_positions:
        line((x, y1),(x, y2))
-
y2 = y1 + row_heightYes, I should have seen that. So much clearer.
x_positions = [random.random() * row_width for _ in range(d)]I understand what’s happening here, but I don’t think I’m experienced enough to think this is more readable than the while loop.
I agree it is the better solution as it obviates the while loop.
Thanks @frederik