@monomonnik Very nice!
andeecollard
@andeecollard
0
Reputation
4
Posts
2
Profile views
0
Followers
0
Following
Best posts made by andeecollard
This user hasn't posted anything yet.
Latest posts made by andeecollard
-
RE: Beginner Questionposted in General Discussion
@monomonnik this has been very helpful. This is getting closer to what I wanted to do:
size(600, 849)

margin = 30
density = 3

fill(None)
strokeWidth(1)
stroke(0)


x = margin

while x < width()-margin:
    line((x,margin),(x,height()-500-margin))
    x += randint(0,density)
    line((x,margin),(x,height()-600-margin))
    x += randint(0,density)
    line((x,margin),(x,height()-200-margin))
    x += randint(0,density)
    line((x,margin),(x,height()-margin))
    x += randint(0,density)
I'd still like to dynamically change the number of bands, their start/finish points and density, but this is a lot better!
Thank you -
RE: Beginner Questionposted in General Discussion
@monomonnik thank you so much! Your second example looks really good. Could I use saved state to implement the bands of different line densities?
-
Beginner Questionposted in General Discussion
Hi, I'm trying to do something and can't get it to work. I suspect it might be the way I'm structuring things.
I want to generate and plot images like this:
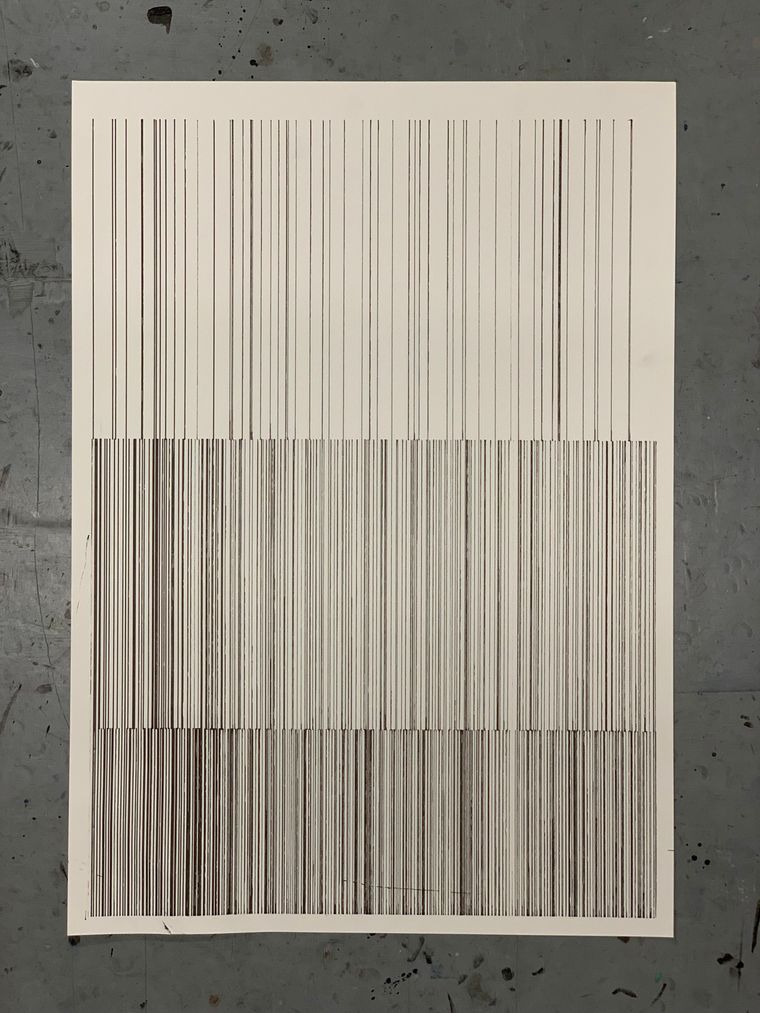
I'm trying to make bands of random lines, but when I try to make a for loop only the first band appears. Here's an example with 2 bands:
size(600, 849)


Density1 = 10
lines1 = 650

Density2 = 5
lines2 = 120

mTop = 20
mBottom = 20
mLeft = 20
mRight = 20

row1bot = 500
row1top = 849 - mTop

row2bot = row1bot
row2top = row1bot - 200


fill(None)
strokeWidth(1)
stroke(0)

for z in range(lines1):
    line((mLeft+10, row1top), (mLeft+10, row1bot))
    # and translate the canvas
    translate((randint(0, Density1)), 0)


for z in range(lines2):
    line((mLeft+10, row1bot), (mLeft+10, row1bot-100))
    # and translate the canvas
    translate((randint(0, Density2)), 0)


code_text
I'm a total beginner and would like to also figure out setting a margin. Any help gratefully received!