Is it possible do this processing.gif in drawbot?
-
Hi
Is it possible, to do thishttps://twitter.com/beesandbombs/status/1337051847157309449?s=20
in drawbot?
If so, maybe any hints how to?
I tried to rebuild, but to many questions I don't find an answer...
-
@pi I think it’s doable. What do you have so far? To which questions didn’t you find an answer?
-
That would be really cool if dooable.
- I would start with a single element, with the movement.
- six points as the blue hexagon, they keep position but change from corner to round
- six points as the pink circle, with changing positions
- questions:
-curveTo() or path.curveTo()?
-how can I do the math for a) the position-change and b) for the bezier-handles-change? with trigonomety, or would I need pi?
- I would do a grid. I'm familiar with a sqare kind of grid. In this case it should be radial. I have no idea how to do this...
As you see, I'm quite at the beginning

-
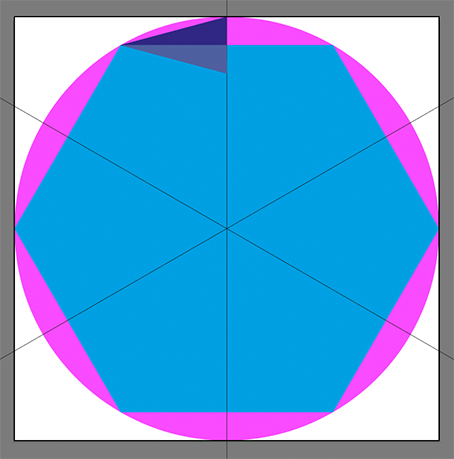
- Without doing too much math, and using some ugly constants, you can draw a segment of the hexagon.
Draw and rotate it six times, and you have the basis of the hexagon.
def draw_segment():
    # Coordinates based on a circle with diameter 1000 and center at 0,0
    first_point = (-500, 0)
    first_control_point = (-500, 185.191467285156)
    second_control_point = (-399.316345214836, 346.863525390625)
    second_point = (-249.704528808587, 433.274108886719)
    # Make and draw path
    bez = BezierPath()
    bez.moveTo(first_point)
    bez.curveTo(first_control_point, second_control_point, second_point)
    drawPath(bez)

def draw_hexagon():
    for i in range(6):
        with savedState():
            translate(500,500)
            scale(0.5, 0.5)
            rotate(i * 60, center=(0, 0))
            draw_segment()

newPage()

fill(None)
stroke(0)
strokeWidth(10)
draw_hexagon()
-
- Changing the bezier-handle is a simple as calculating a point between two extremes, based on a percentage, based on how far you are in your animation.
(Check out easings.net to create smoother animations)
frames = 12

def draw_segment(percentage):
    first_point = (-500, 0)
    first_control_point_convex = (-500, 185.191467285156)
    first_control_point_concave = (-350.388183585986, 86.410583482659)
    second_control_point_convex = (-399.316345214836, 346.863525390625)
    second_control_point_concave = (-249.704528786313,248.082641579087)
    second_point = (-249.704528808587, 433.274108886719)
    # Calculate in-between points based on percentage
    fcpcx = first_control_point_convex[0] + percentage * (first_control_point_concave[0] - first_control_point_convex[0])
    fcpcy = first_control_point_convex[1] + percentage * (first_control_point_concave[1] - first_control_point_convex[1])
    scpcx = second_control_point_convex[0] + percentage * (second_control_point_concave[0] - second_control_point_convex[0])
    scpcy = second_control_point_convex[1] + percentage * (second_control_point_concave[1] - second_control_point_convex[1])
    first_control_point = (fcpcx, fcpcy)
    second_control_point = (scpcx, scpcy)
    # Make and draw path
    bez = BezierPath()
    bez.moveTo(first_point)
    bez.curveTo(first_control_point, second_control_point, second_point)
    drawPath(bez)

def draw_hexagon(percentage):
    for i in range(6):
        with savedState():
            translate(500,500)
            scale(0.5, 0.5)
            rotate(i * 60, center=(0, 0))
            draw_segment(percentage)

for i in range(frames):
    newPage()

    fill(None)
    stroke(0)
    strokeWidth(10)

    percentage = i / frames
    draw_hexagon(percentage)

for i in range(frames, 0, -1):
    newPage()

    fill(None)
    stroke(0)
    strokeWidth(10)

    percentage = i / frames
    draw_hexagon(percentage)

saveImage("animated.gif")
-
- I don’t think you need a radial grid.
If you base the timing of the animation of one hexagon on its distance to the center point, I believe you get the same effect as in your example.
-
an other solution!
# amount of corners, 6 will create a hexagon
corners = 6
# the radius of the circle
radius = 100
# amount of frames
frames = 24
# calculate the step in radians of each corner
angleStep = pi * 2 / corners
# calculate the distance between each point on the circle
# based on the cos, sin of the angle the opposite 'c' can be
# calculated with pythagoras
distance = sqrt((radius - cos(angleStep) * radius) ** 2 + (sin(angleStep) * radius) ** 2)
# calculate the offcurve handle length
offCurveLength = distance * 0.38
# the extremes of factors we would like to use
minFactor = .3
maxFactor = 2
# start the loop
for i in range(frames):
    # calculate a factor and normalize so it goes from 0 -> 1 -> 0
    # to create a loop
    factor = i / (frames) * 2
    if factor > 1:
        factor = 2 - factor
    # interpolate the factor with our min max settings
    factor = minFactor + (maxFactor - minFactor) * factor
    # create a new page
    newPage(radius * 4, radius * 4)
    # draw a white background (gifs dont have an alpha value)
    with savedState():
        fill(1)
        rect(0, 0, width(), height())
    # translate to the middle
    translate(width() / 2, height() / 2)
    # create a pen
    pen = BezierPath()
    # use the pen as a point pen
    # so we can just add point instead of segments
    pen.beginPath()
    # start a loop over all corners
    for i in range(corners):
        # get the angle of each corner
        angle = angleStep * i
        # get the x, y position based on the angle and radius
        x = cos(angle) * radius
        y = sin(angle) * radius
        # get the off curces based on the hooked angle (+90°)
        # and multiply by the factor
        offx1 = (x + cos(angle + pi / 2) * offCurveLength) * factor
        offy1 = (y + sin(angle + pi / 2) * offCurveLength) * factor

        offx2 = (x - cos(angle + pi / 2) * offCurveLength) * factor
        offy2 = (y - sin(angle + pi / 2) * offCurveLength) * factor
        # add the point to the point pen path
        pen.addPoint((offx2, offy2))
        pen.addPoint((x, y), segmentType="curve")
        pen.addPoint((offx1, offy1))
    # tell the path the drawing is done
    pen.endPath()
    # draw the path
    stroke(1, 0, 1, 1)
    strokeWidth(10)
    fill(None)
    drawPath(pen)
# save the gif
saveImage("circleHex.gif")
-
A simple example of how to move the wave through a grid of dots. The position of the dots does not matter.
@frederik probably has a better and more robust solution for this also

-
frames = 24
page_size = 1000
grid_size = 20
grid_spacing = page_size / grid_size
min_dot_size = 10
max_dot_size = 50
radius = 100

def draw_dot(center, diameter):
    x = center[0] - diameter / 2
    y = center[1] - diameter / 2
    oval(x, y, diameter, diameter)

for f in range(frames):
    percentage_animated = f / frames
    newPage()

    fill(0)
    rect(0, 0, page_size, page_size)

    for row in range(grid_size):
        for column in range(grid_size):
            x = row * grid_spacing + grid_spacing / 2
            y = column * grid_spacing + grid_spacing / 2
            # Calculate distance from (x,y) of the dot to the center of the page
            distance = pow( (pow(x - page_size / 2, 2 ) + pow(y - page_size / 2, 2)), 0.5)
            # The wave must seem to move, so for every frame in the
            # animation, add a precentage of the length of the wave.
            # Add or substract to change direction.
            distance = distance - percentage_animated * radius * 2
            # Use modulo to get a distance between 0 and double the radius
            distance = distance % (radius * 2)
            # The wave has a lenghth of double the radius. In the
            # first halve of the lenght, the dots get larger, in the
            # second halve the dots get smaller.
            # So, we calculate a percentage between 0 and 2, and when
            # the percentage is larger than 1, we count backwards.
            percentage = distance / radius
            if percentage > 1:
                percentage = 2 - percentage
            dot_size = min_dot_size + percentage * (max_dot_size - min_dot_size)
            fill(1)
            draw_dot((x,y), dot_size)

saveImage("animated.gif")
-
Almost the same code, but instead of drawing a grid we draw 1000 circles randomly. As they have to stay in the same place, we save their locations in an array.
(Also in this script some nice code to have if you want to publish animated gifs; a way to reduce the colours in the gif.)
import random
import struct

frames = 24
page_size = 1000
number_of_circles = 1000
min_dot_size = 10
max_dot_size = 70
radius = 200


# create color table for gif
# https://stackoverflow.com/questions/6269765/what-does-the-b-character-do-in-front-of-a-string-literal
table = b""
greys = [0,85,170,255]
for i in greys:
    r = struct.pack(">B", i)
    g = struct.pack(">B", i)
    b = struct.pack(">B", i)
    table += r + g + b # + a


def draw_dot(center, diameter):
    x = center[0] - diameter / 2
    y = center[1] - diameter / 2
    oval(x, y, diameter, diameter)


# Generate circles, randomly distributed
circles = []
for i in range(number_of_circles):
    x = random.randint(0,page_size)
    y = random.randint(0,page_size)
    circles.append((x,y))


for f in range(frames):
    percentage_animated = f / frames
    newPage()

    fill(0)
    rect(0, 0, page_size, page_size)

    for c in circles:
        x = c[0]
        y = c[1]
        distance = pow( (pow(x - page_size / 2, 2 ) + pow(y - page_size / 2, 2)), 0.5)
        distance = distance - percentage_animated * radius * 2
        distance = distance % (radius * 2)
        percentage = distance / radius
        if percentage > 1:
            percentage = 2 - percentage
        dot_size = min_dot_size + percentage * (max_dot_size - min_dot_size)
        fill(None)
        stroke(1)
        draw_dot((x,y), dot_size)

saveImage("animated.gif", imageGIFRGBColorTable = table)
-
@monomonnik
How could you figure out the control-points and the second point for the segment (your first code snippet)?
(My "solution" would be, draw it in illustrator at the right coordinates, and copy/paste the numbers to drawbot.)
-
It's fantastic, what is possible in drawbot!
Thank you @monomonnik for your great help!
Also @frederik for other interesting solutions! Thank you both
Some really new topics to me, and I need some time to understand step by (small) step.
-
@pi That is exactly my solution. It’s not elegant, but it’s quick and it works.
Below is the Applescript I used. If you name your paths in Illustrator and put the names in pathNames it will copy the coordinates of the points and corresponding control points to an array you can paste in DrawBot.
on run
	set pathNames to {"segment_concave"}
	set pathsArray to "segment = ["

	tell application "Adobe Illustrator"
		activate
		set docRef to current document

		repeat with pathName in pathNames
			set pointsArray to "["
			set itemRef to path item pathName of docRef

			set pointsRef to every path point of itemRef
			repeat with pointRef in pointsRef
				-- anchor point
				set pointAsString to "["
				set x to my string_float(item 1 of anchor of pointRef)
				set y to my string_float(item 2 of anchor of pointRef)
				set pointAsString to pointAsString & "(" & x & "," & y & "), "

				-- left bcp
				set x to my string_float(item 1 of left direction of pointRef)
				set y to my string_float(item 2 of left direction of pointRef)
				set pointAsString to pointAsString & "(" & x & "," & y & "), "

				-- right bcp
				set x to my string_float(item 1 of right direction of pointRef)
				set y to my string_float(item 2 of right direction of pointRef)
				set pointAsString to pointAsString & "(" & x & "," & y & ")"

				set pointAsString to pointAsString & "]"
				set pointsArray to pointsArray & pointAsString & ", "
			end repeat
			set pointsArrayLength to length of pointsArray
			set pointsArray to (characters 1 through (pointsArrayLength - 2) of pointsArray) as string
			set pointsArray to pointsArray & "]"

			set pathsArray to pathsArray & pointsArray & ", "
		end repeat
		set pathsArrayLength to length of pathsArray
		set pathsArray to (characters 1 through (pathsArrayLength - 2) of pathsArray) as string
		set pathsArray to pathsArray & "]"

	end tell

	activate
	set the clipboard to pathsArray
	log pathsArray
end run


on string_float(s)
	set s to s as string
	set new_s to ""
	repeat with c in s
		if c as string is equal to "," then set c to "."
		set new_s to new_s & c as string
	end repeat
	return new_s
end string_float
-
@frederik: Why is it 0.38?
# calculate the offcurve handle length
offCurveLength = distance * 0.38
Still a few things I don't understand so far.
And I didn't find out, how to have one color for the circle, and a second color for the star.BUT IT WORKS, thanks to all your inputs!
And it's fun to figure things out (if there's no deadline ).
).
This is my result (probably not with a very clean code...):frames = 36 ## circleHex corners = 6 radius_hex = 3*8 angleStep = pi * 2 / corners # = 1.0471975511965976 distance_hex = sqrt((radius_hex - cos(angleStep)*radius_hex) **2 + (sin(angleStep)*radius_hex) **2) # =radius_hex offCurveLength = distance_hex * 0.38 minFactor = .6 maxFactor = 1 grid_spacingX = radius_hex/3 * 4 # 32 grid_spacingY = 28 # radius_hex/3 * 4 - 4 --> doesn's work stepsX = 27 stepsY = 15 pageW = 24*grid_spacingX + 2*radius_hex # 816 pageH = 14*grid_spacingY + 2*radius_hex # 440 radius_wave = pageW/4 for f in range(frames): newPage(pageW, pageH) fill(0) rect(0, 0, pageW, pageH) ## circleHex factor = f / frames * 2 if factor > 1: factor = 2 - factor percentage_animated = f / frames for row in range(stepsX): for column in range(stepsY): x = row * grid_spacingX y = column * grid_spacingY # Calculate distance from (x,y) of each circleHex to the center of the page distance = pow( (pow(x - pageW/2, 2 ) + pow(y - pageH/2 + grid_spacingY, 2)), 0.5) # The wave must seem to move, so for every frame in the # animation, add a precentage of the length of the wave. # Add or substract to change direction. distance = distance - percentage_animated * radius_wave * 2 # Use modulo to get a distance between 0 and double the radius distance = distance % (radius_wave * 2) # The wave has a lenghth of double the radius. In the # first halve of the lenght, the dots get larger, in the # second halve the dots get smaller. # So, we calculate a percentage between 0 and 2, and when # the percentage is larger than 1, we count backwards. percentage = distance / radius_wave if percentage > 1: percentage = 2 - percentage # interpolate the factor with our min max settings factor = minFactor + percentage * (maxFactor - minFactor) blendMode("hardLight") fill(0.8,0,0.8, .3) strokeWidth(None) with savedState(): if y in range(0, pageH, grid_spacingY*2): print(y) pen = BezierPath() pen.beginPath() translate(x + radius_hex - grid_spacingX/2, y + radius_hex) for i in range(corners): angle = angleStep * i x = cos(angle) * radius_hex y = sin(angle) * radius_hex offx1 = (x + cos(angle + pi / 2) * offCurveLength) * factor offy1 = (y + sin(angle + pi / 2) * offCurveLength) * factor offx2 = (x - cos(angle + pi / 2) * offCurveLength) * factor offy2 = (y - sin(angle + pi / 2) * offCurveLength) * factor pen.addPoint((offx2, offy2)) pen.addPoint((x, y), segmentType="curve") pen.addPoint((offx1, offy1)) pen.endPath() drawPath(pen) else: pen = BezierPath() pen.beginPath() translate(x + radius_hex - grid_spacingX, y + radius_hex) for i in range(corners): angle = angleStep * i x = cos(angle) * radius_hex y = sin(angle) * radius_hex offx1 = (x + cos(angle + pi / 2) * offCurveLength) * factor offy1 = (y + sin(angle + pi / 2) * offCurveLength) * factor offx2 = (x - cos(angle + pi / 2) * offCurveLength) * factor offy2 = (y - sin(angle + pi / 2) * offCurveLength) * factor pen.addPoint((offx2, offy2)) pen.addPoint((x, y), segmentType="curve") pen.addPoint((offx1, offy1)) pen.endPath() drawPath(pen)
-
-
@pi said in Is it possible do this processing.gif in drawbot?:
@frederik: Why is it 0.38?
the handle of the off curve is 38% of the distance between the oncurve points, that seems to be generating nice curves
")
-
@frederik
Cool, thanks - less math, more trying out