@frederik
Cool, thanks - less math, more trying out 
pi
@pi
Best posts made by pi
Latest posts made by pi
-
RE: Is it possible do this processing.gif in drawbot?posted in General Discussion
-
RE: Is it possible do this processing.gif in drawbot?posted in General Discussion
@frederik: Why is it 0.38?
# calculate the offcurve handle length
offCurveLength = distance * 0.38
Still a few things I don't understand so far.
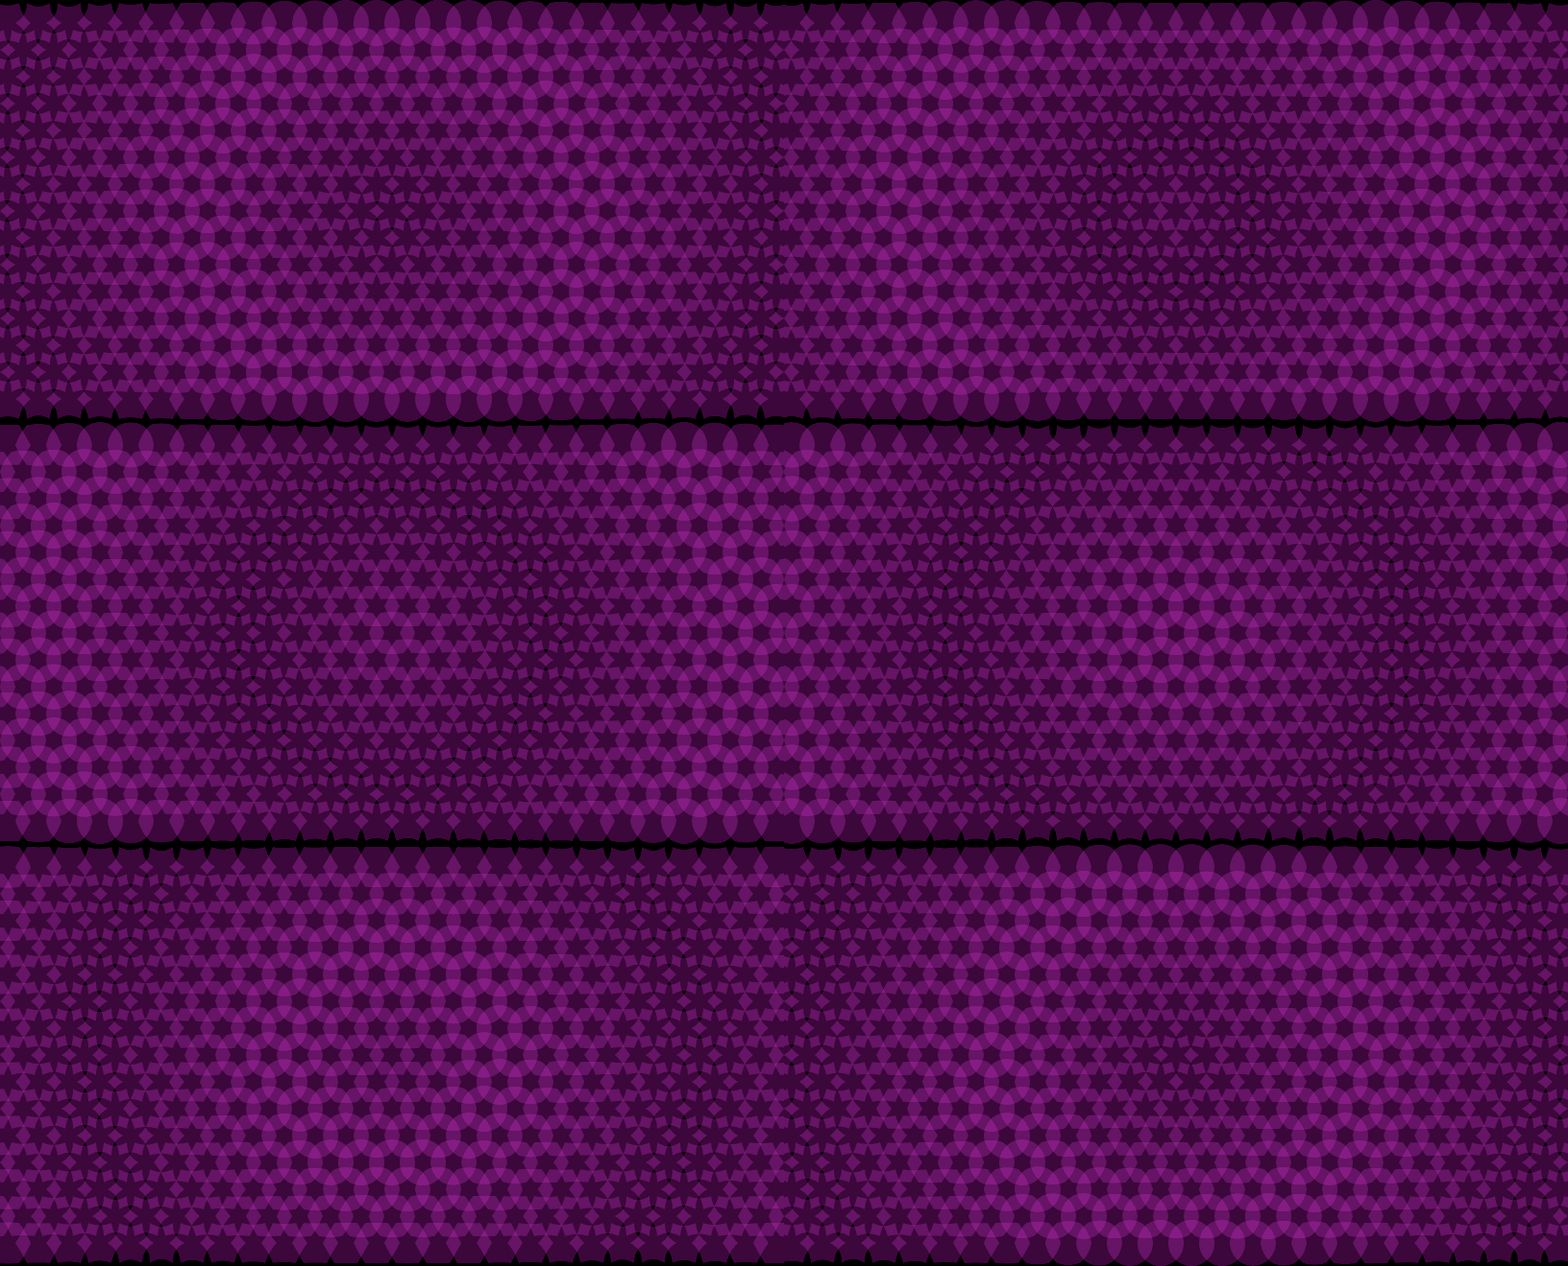
And I didn't find out, how to have one color for the circle, and a second color for the star.BUT IT WORKS, thanks to all your inputs!
And it's fun to figure things out (if there's no deadline ).
).
This is my result (probably not with a very clean code...):frames = 36 ## circleHex corners = 6 radius_hex = 3*8 angleStep = pi * 2 / corners # = 1.0471975511965976 distance_hex = sqrt((radius_hex - cos(angleStep)*radius_hex) **2 + (sin(angleStep)*radius_hex) **2) # =radius_hex offCurveLength = distance_hex * 0.38 minFactor = .6 maxFactor = 1 grid_spacingX = radius_hex/3 * 4 # 32 grid_spacingY = 28 # radius_hex/3 * 4 - 4 --> doesn's work stepsX = 27 stepsY = 15 pageW = 24*grid_spacingX + 2*radius_hex # 816 pageH = 14*grid_spacingY + 2*radius_hex # 440 radius_wave = pageW/4 for f in range(frames): newPage(pageW, pageH) fill(0) rect(0, 0, pageW, pageH) ## circleHex factor = f / frames * 2 if factor > 1: factor = 2 - factor percentage_animated = f / frames for row in range(stepsX): for column in range(stepsY): x = row * grid_spacingX y = column * grid_spacingY # Calculate distance from (x,y) of each circleHex to the center of the page distance = pow( (pow(x - pageW/2, 2 ) + pow(y - pageH/2 + grid_spacingY, 2)), 0.5) # The wave must seem to move, so for every frame in the # animation, add a precentage of the length of the wave. # Add or substract to change direction. distance = distance - percentage_animated * radius_wave * 2 # Use modulo to get a distance between 0 and double the radius distance = distance % (radius_wave * 2) # The wave has a lenghth of double the radius. In the # first halve of the lenght, the dots get larger, in the # second halve the dots get smaller. # So, we calculate a percentage between 0 and 2, and when # the percentage is larger than 1, we count backwards. percentage = distance / radius_wave if percentage > 1: percentage = 2 - percentage # interpolate the factor with our min max settings factor = minFactor + percentage * (maxFactor - minFactor) blendMode("hardLight") fill(0.8,0,0.8, .3) strokeWidth(None) with savedState(): if y in range(0, pageH, grid_spacingY*2): print(y) pen = BezierPath() pen.beginPath() translate(x + radius_hex - grid_spacingX/2, y + radius_hex) for i in range(corners): angle = angleStep * i x = cos(angle) * radius_hex y = sin(angle) * radius_hex offx1 = (x + cos(angle + pi / 2) * offCurveLength) * factor offy1 = (y + sin(angle + pi / 2) * offCurveLength) * factor offx2 = (x - cos(angle + pi / 2) * offCurveLength) * factor offy2 = (y - sin(angle + pi / 2) * offCurveLength) * factor pen.addPoint((offx2, offy2)) pen.addPoint((x, y), segmentType="curve") pen.addPoint((offx1, offy1)) pen.endPath() drawPath(pen) else: pen = BezierPath() pen.beginPath() translate(x + radius_hex - grid_spacingX, y + radius_hex) for i in range(corners): angle = angleStep * i x = cos(angle) * radius_hex y = sin(angle) * radius_hex offx1 = (x + cos(angle + pi / 2) * offCurveLength) * factor offy1 = (y + sin(angle + pi / 2) * offCurveLength) * factor offx2 = (x - cos(angle + pi / 2) * offCurveLength) * factor offy2 = (y - sin(angle + pi / 2) * offCurveLength) * factor pen.addPoint((offx2, offy2)) pen.addPoint((x, y), segmentType="curve") pen.addPoint((offx1, offy1)) pen.endPath() drawPath(pen) -
RE: Is it possible do this processing.gif in drawbot?posted in General Discussion
It's fantastic, what is possible in drawbot!
Thank you @monomonnik for your great help!
Also @frederik for other interesting solutions! Thank you both
Some really new topics to me, and I need some time to understand step by (small) step.
-
RE: Is it possible do this processing.gif in drawbot?posted in General Discussion
@monomonnik
How could you figure out the control-points and the second point for the segment (your first code snippet)?
(My "solution" would be, draw it in illustrator at the right coordinates, and copy/paste the numbers to drawbot.) -
RE: Is it possible do this processing.gif in drawbot?posted in General Discussion
That would be really cool if dooable.
- I would start with a single element, with the movement.
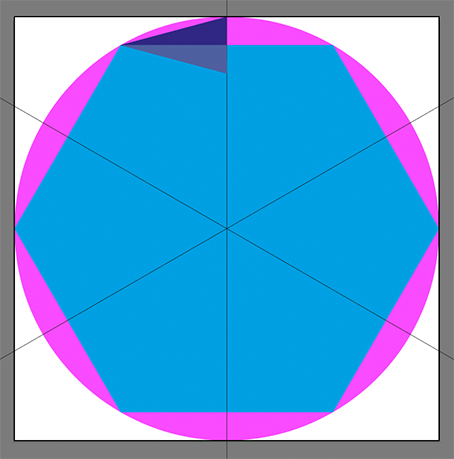
- six points as the blue hexagon, they keep position but change from corner to round
- six points as the pink circle, with changing positions

- questions:
-curveTo() or path.curveTo()?
-how can I do the math for a) the position-change and b) for the bezier-handles-change? with trigonomety, or would I need pi?
- I would do a grid. I'm familiar with a sqare kind of grid. In this case it should be radial. I have no idea how to do this...
As you see, I'm quite at the beginning

-
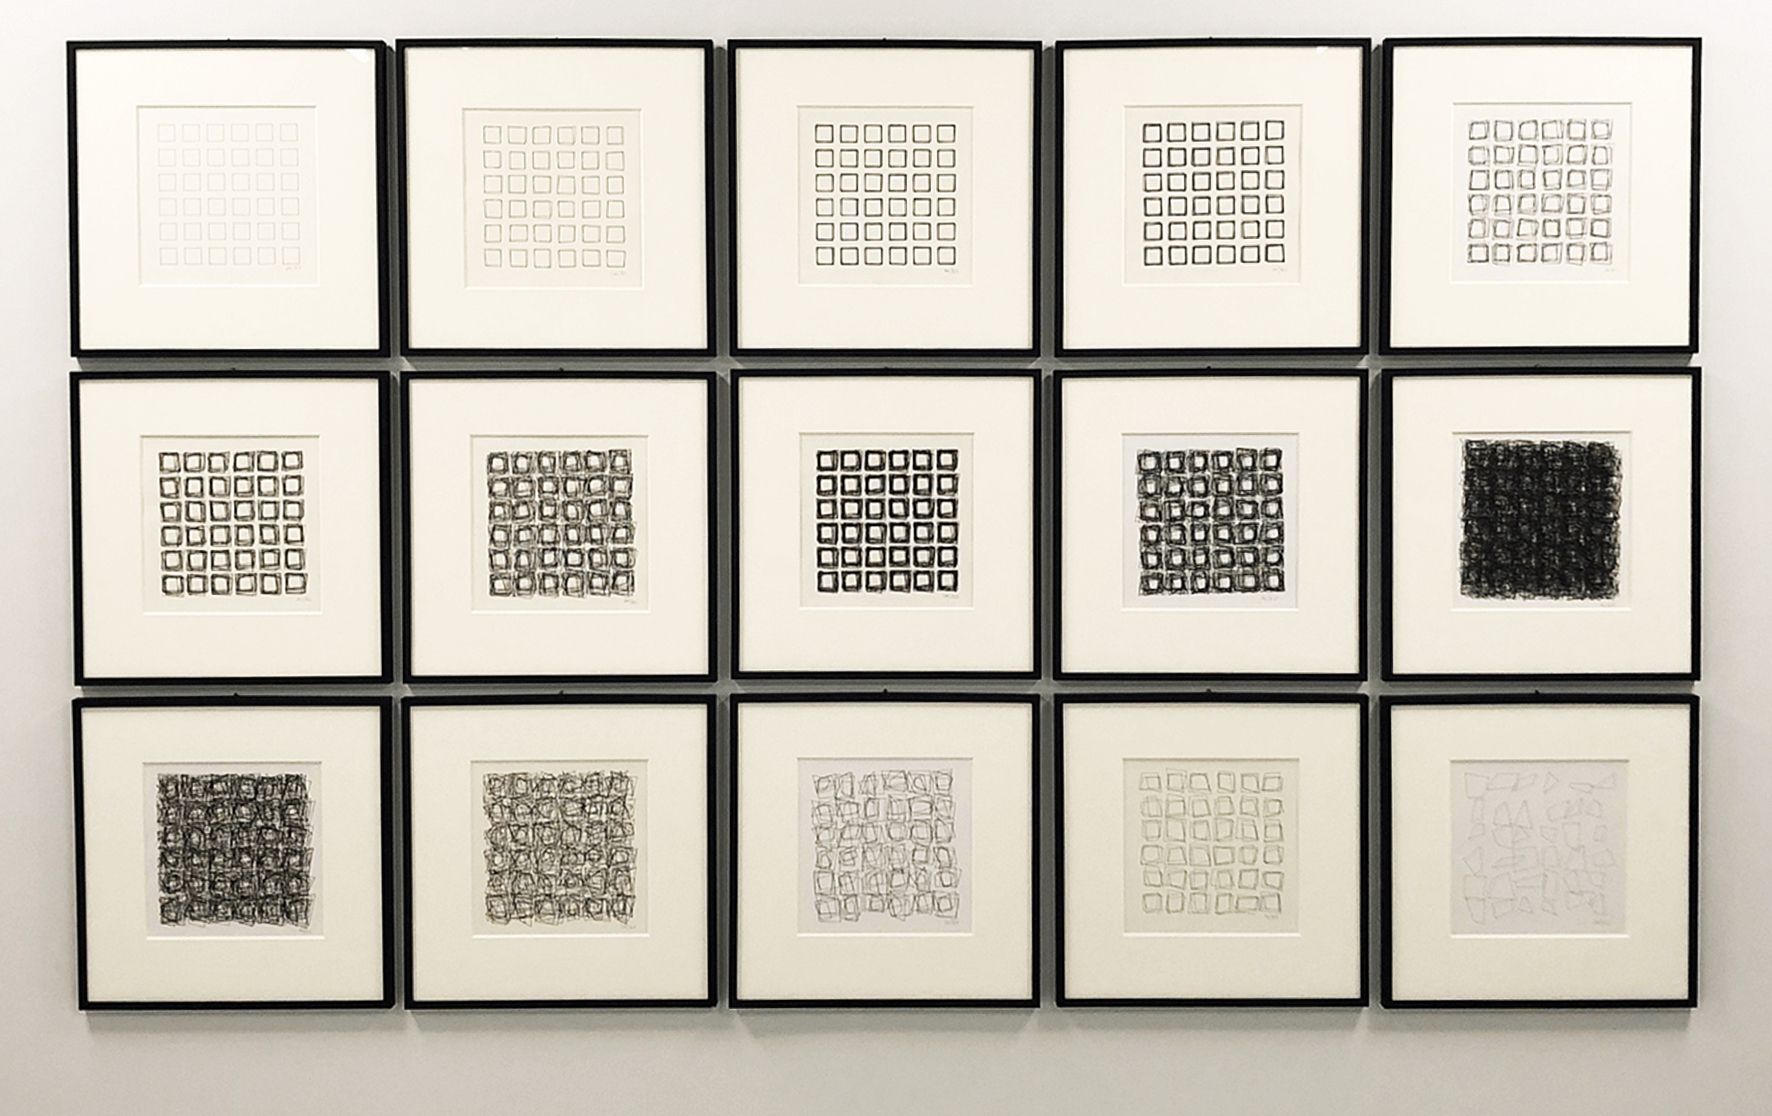
Inspired by Vera Molnarposted in Code snippets
I've tried to make something like this:

This is my result:
border = 110
dist = 50
cellXY = ( width()- 2*border - 4*dist ) / 5
print(cellXY)

for x in range(5):
    posX = border + x*(cellXY+dist)
    for y in range(5):
        posY = border + y*(cellXY+dist)
        for z in range(33):
            with savedState():
                size = randint(60,110)
                stroke(0,0,0, 0.4+random())
                strokeWidth(.2 + .5*random())
                blendMode("multiply")
                translate(posX + cellXY/2 - size/2, posY + cellXY/2 - size/2)
                rotate(randint(-12,12), center=(size/2, size/2))
                middle = randint(-8,8)
                rect(middle, middle, size, size)
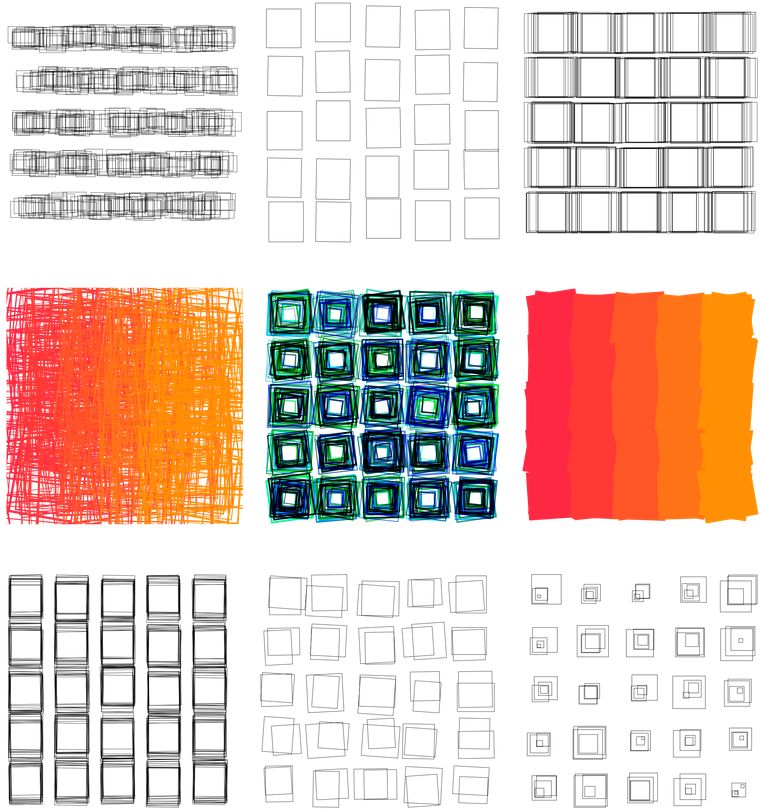
And it was fun to do some variations:

-
Is it possible do this processing.gif in drawbot?posted in General Discussion
Hi
Is it possible, to do thishttps://twitter.com/beesandbombs/status/1337051847157309449?s=20
in drawbot?
If so, maybe any hints how to?
I tried to rebuild, but to many questions I don't find an answer...
