Drawing a circle with Beziers
-
You cannot draw a circle with Beziers.
When I first read this some time ago I was a bit confused.
Why is this not a circle. It sure looks like one.After learning a bit more about curve descriptions and calculations I kind of agree but the quote should better say:
You cannot draw a perfect circle with Beziers.
Getting the best tangent values.
We have a formula to calculate points on a Bezier Curve.
x = (1-t)**3*p1[0] + 3*(1-t)**2*t*t1[0] + 3*(1-t)*t**2*t2[0] + t**3*p2[0]
y = (1-t)**3*p1[1] + 3*(1-t)**2*t*t1[1] + 3*(1-t)*t**2*t2[1] + t**3*p2[1]
p1 and p2 are the two endpoints and t1 and t2 the two tangent points. t is the factor (0-1) at which we want the point on the curve.
On a bezier curve with the following coördinates:
p1 = (1, 0)
p2 = (0, 1)
t1 = (1, tangent_val)
t2 = (tangent_val, 1)
we can calculate the tangent_val if we assume that the point at t=0.5 (halfway the curve) is exactly on the circle. Halfway of a quartercircle is 45 degrees so x and y are both at 1/sqrt(2). If we plug these numbers into the formula we can calculate the tangent value:
1/sqrt(2) = (1-.5)**3*1 + 3*(1-.5)**2*.5*1 + 3*(1-.5)*.5**2*tangent_val + .5**3*0
...
tangent_val = 4*(sqrt(2)-1)/3 ≈ 0.5522847493
With this tangent_val we can calculate other points on the bezier curve. Of which we can calculate the angle in respect to the center point at (0, 0). And with this angle we can use sine and cosine to get the point that would be on a circle.
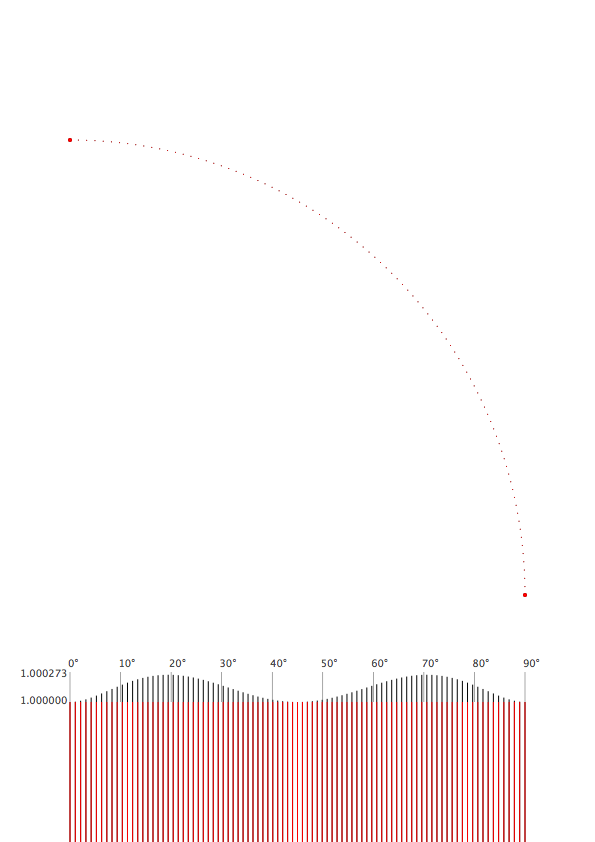
We can also calculate the distance of the bezier point and see where the offset is the biggest. As we can see the difference is really tiny. With a radius of 1 the biggest off value is 1.0002725295591013 (not even one permille). The difference is hardly visible so I added only the top part of a really long bar chart to make it show.
See the image below:
Code
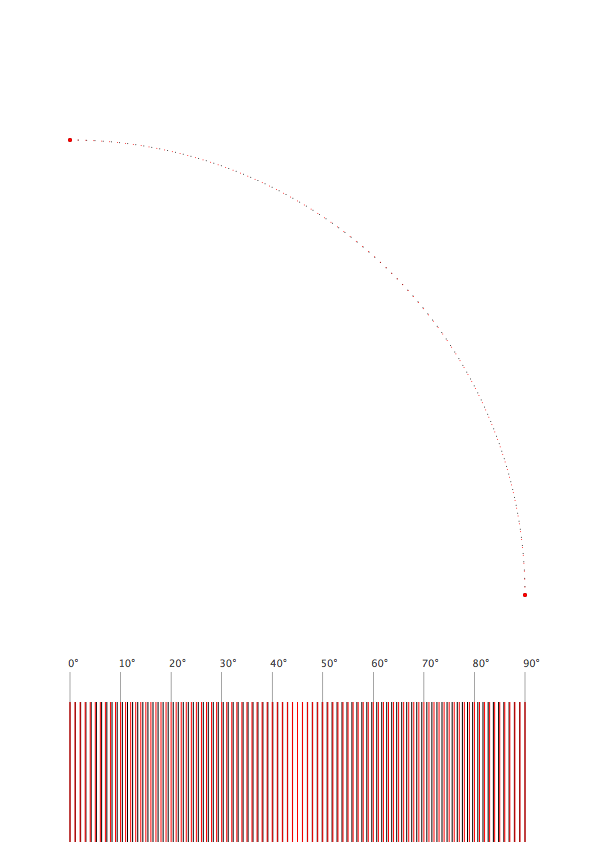
# -------------------
#  settings

pw, ph = 595, 842 #A4
margin = 70

tang = 4*(sqrt(2)-1)/3
r = pw - 2 * margin

density = 90 # amount of points
dia_ = 1 # diameter to draw the points

r_plot = 100000 # this is a magnifying factor to make the tiny difference visible.

r_plot_y = margin - r_plot   #radius plotting
c_plot_y = ph - 3 * margin - r  # circle plotting

# -------------------
#  functions

def get_bezier_p(p1, t1, t2, p2, t):
    ''' get the point on a bezier curve at t (should be between 0 and 1) '''
    x = (1 - t)**3 * p1[0] + 3*(1 - t)**2 * t * t1[0] + 3*(1 - t)* t**2 * t2[0] + t**3 * p2[0]
    y = (1 - t)**3 * p1[1] + 3*(1 - t)**2 * t * t1[1] + 3*(1 - t)* t**2 * t2[1] + t**3 * p2[1]
    return x, y

def get_dist(p1, p2):
    ''' returns the distance between two points (x, y)'''
    return sqrt((p2[0]-p1[0])**2 + (p2[1]-p1[1])**2)

# -------------------
#  drawings

newPage(pw, ph)
fill(1)
rect(0, 0, pw, ph)
translate(margin, margin)

# draw the tangent points
rect(r - dia_, c_plot_y + tang*r - dia_, dia_*2, dia_*2)
rect(tang*r -dia_, c_plot_y + r - dia_, dia_*2, dia_*2)

max_off = 1

for i in range(density+1):

    # -------
    #  bezier

    # calculate the factor f
    f = i/density
    fill(0)
    if i == 0 or i == (density): dia = dia_ * 4
    else: dia = dia_
    # get the coordinates for the point at factor f
    x_b, y_b = get_bezier_p( (1, 0), (1, tang), (tang, 1), (0, 1), f )
    # get the distance of the point from the center at (0, 0)
    r_b = get_dist((0, 0), (x_b, y_b))
    max_off = max(max_off, r_b)
    # get the angle of the point
    angle = atan2(y_b, x_b)
    # draw the point and a rect for the bar chart
    oval(x_b * r - dia/2, c_plot_y + y_b * r - dia/2, dia, dia)
    rect((angle/(pi/2)) * r - dia_/2, r_plot_y, dia_, r_plot * r_b)

    # -------
    #  circle

    fill(1, 0, 0)

    # get the point on a circle
    x_c, y_c = cos(angle), sin(angle)
    # draw the point and a rect for the bar chart
    oval(x_c * r - dia/2, c_plot_y + y_c * r - dia/2, dia, dia)
    rect((angle/(pi/2)) * r - dia_/2, r_plot_y, dia_, r_plot)

    fill(.3)
    if i % 10 == 0:
        x_p, y_p = r * f, margin #* 1.5
        rect(x_p - .25, y_p, .5, 30)
        text('%d°' % (f * 90), (x_p-2, y_p * 1.5))

print (max_off)
text('%.6f' % max_off, (-50, max_off * r_plot - r_plot + margin - 2))
text('%.6f' % 1, (-50, margin - 2))
The maybe more interesting peculiarity of bezier curves is the difference between time and distance. We can compare the bezier distance at factor f (0-1) to the circle if we use the same factor to get the appropriate fraction of 90 degrees.
Code
# -------------------
#  settings

pw, ph = 595, 842 #A4
margin = 70

tang = 4*(sqrt(2)-1)/3
r = pw - 2 * margin

density = 90 # amount of points
dia_ = 1 # diameter to draw the points

r_plot = 100000 # this is a magnifying factor to make the tiny difference visible.

r_plot_y = margin - r_plot   #radius plotting
c_plot_y = ph - 3 * margin - r  # circle plotting

# -------------------
#  functions

def get_bezier_p(p1, t1, t2, p2, t):
    ''' get the point on a bezier curve at t (should be between 0 and 1) '''
    x = (1 - t)**3 * p1[0] + 3*(1 - t)**2 * t * t1[0] + 3*(1 - t)* t**2 * t2[0] + t**3 * p2[0]
    y = (1 - t)**3 * p1[1] + 3*(1 - t)**2 * t * t1[1] + 3*(1 - t)* t**2 * t2[1] + t**3 * p2[1]
    return x, y

def get_dist(p1, p2):
    ''' returns the distance between two points (x, y)'''
    return sqrt((p2[0]-p1[0])**2 + (p2[1]-p1[1])**2)

# -------------------
#  drawings

newPage(pw, ph)
fill(1)
rect(0, 0, pw, ph)
translate(margin, margin)

# draw the tangent points
rect(r - dia_, c_plot_y + tang*r - dia_, dia_*2, dia_*2)
rect(tang*r -dia_, c_plot_y + r - dia_, dia_*2, dia_*2)


for i in range(density+1):

    # -------
    #  bezier

    # calculate the factor f
    f = i/density
    fill(0)
    if i == 0 or i == (density): dia = dia_ * 4
    else: dia = dia_
    # get the coordinates for the point at factor f
    x_b, y_b = get_bezier_p( (1, 0), (1, tang), (tang, 1), (0, 1), f )
    # get the distance of the point from the center at (0, 0)
    r_b = get_dist((0, 0), (x_b, y_b))
    # get the angle of the point
    angle = atan2(y_b, x_b)
    # draw the point and a rect for the bar chart
    oval(x_b * r - dia/2, c_plot_y + y_b * r - dia/2, dia, dia)
    rect((angle/(pi/2)) * r - dia_/2, r_plot_y, dia_, r_plot)

    # -------
    #  circle

    fill(1, 0, 0)

    # get the point on a circle
    x_c, y_c = cos( pi/2*f ), sin( pi/2*f )
    # draw the point and a rect for the bar chart
    oval(x_c * r - dia/2, c_plot_y + y_c * r - dia/2, dia, dia)
    rect(f * r - dia_/2, r_plot_y, dia_, r_plot)

    fill(.3)
    if i % 10 == 0:
        x_p, y_p = r * f, margin #* 1.5
        rect(x_p - .25, y_p, .5, 30)
        text('%d°' % (f * 90), (x_p-2, y_p * 1.5))