Navigation

    • Register
    • Login
    • Search
    • Categories
    • Recent
    • Tags
    • Users
    • Groups
    • Solved
    • Unsolved
    • Search
    1. Home
    2. MauriceMeilleur
    • Profile
    • Following
    • Followers
    • Topics
    • Posts
    • Best
    • Groups

    MauriceMeilleur

    @MauriceMeilleur

    11
    Reputation
    110
    Posts
    1055
    Profile views
    1
    Followers
    0
    Following
    Joined Last Online

    MauriceMeilleur Follow

    Best posts made by MauriceMeilleur

    • RE: A little arcTo() and geometry help?

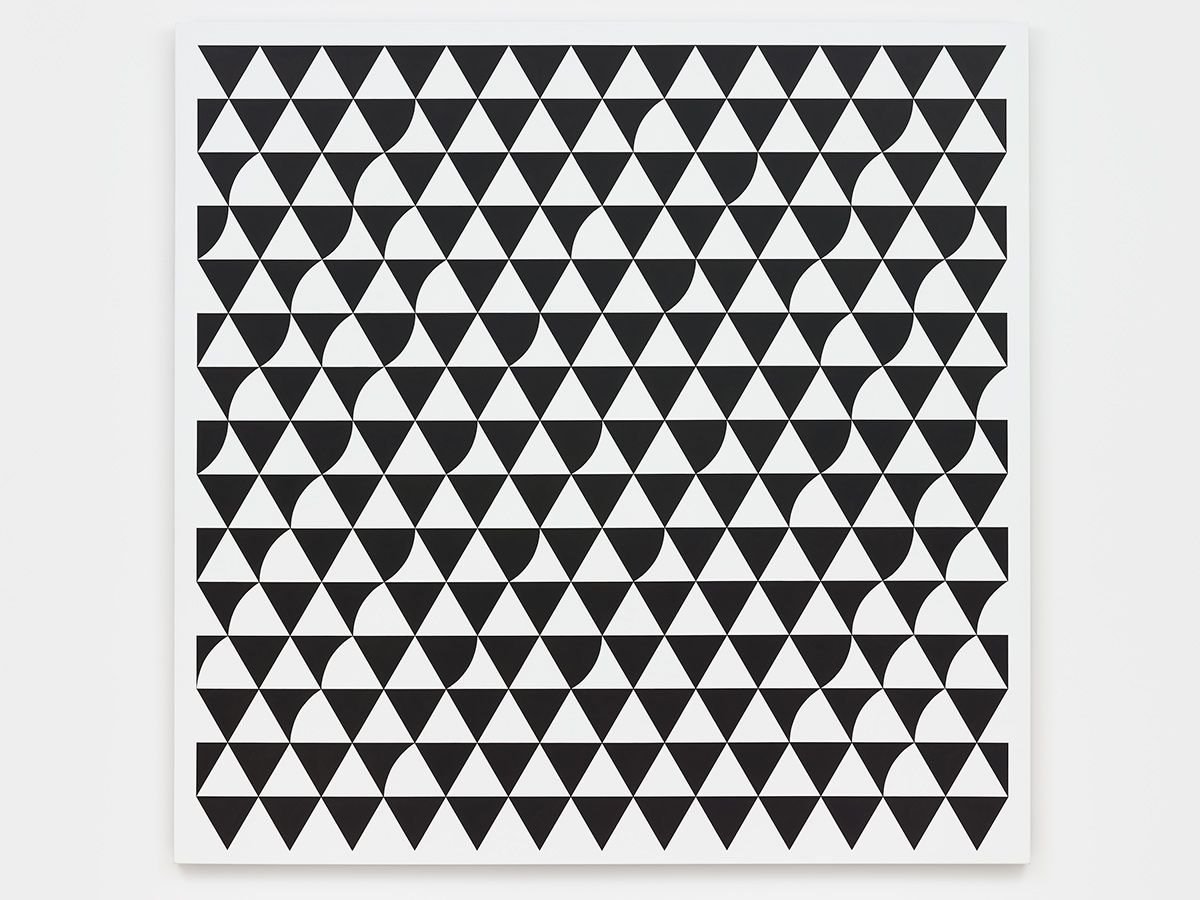
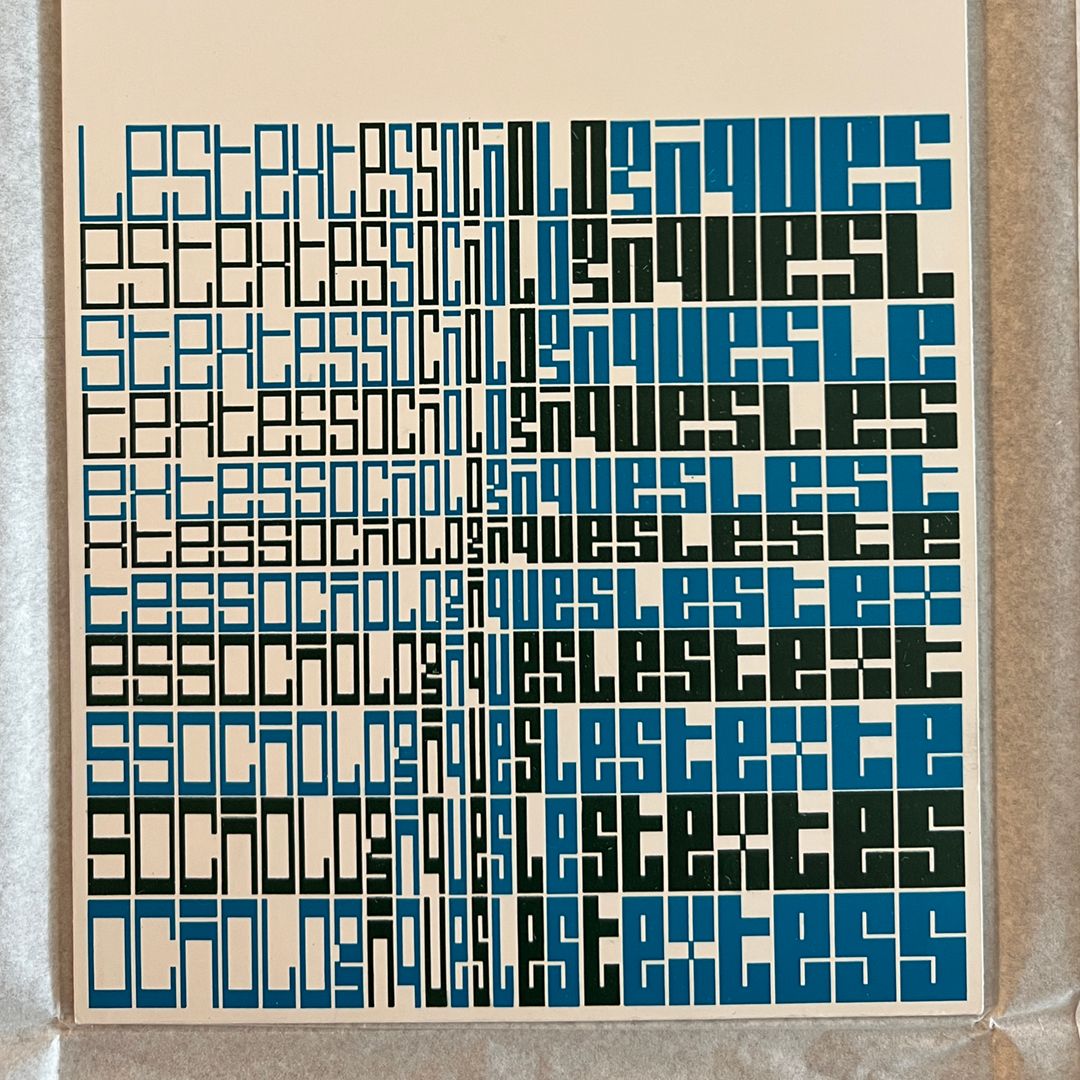
      The finished product, a tribute to Bridget Riley's Rustle 6 (2015).

      riley_tribute_test_01_2019-11-07 07:20:53.494025.gif

      import math
      
      canvasX = 600
      canvasY = 600
      nFrames = 120
      side = canvasX/14
      height = (side * sqrt(3))/2
      center = (side/sqrt(3))/2
      nX = 14
      nY = 15
      offsetX = side
      offsetY = height
      
      from datetime import *
      time = datetime.now()
      
      def interpolate(pt1, pt2, ratio):
          assert ratio <= 1
          return (pt1[0] + (ratio * (pt2[0] - pt1[0])), pt1[1] + (ratio * (pt2[1] - pt1[1])))
          
      def triangle(s, h, c, inout):
          assert inout >= 0 and inout <= 1
          start = (-s/2, h/2)
          pivot = (0, h/2 - (c * 3))
          target = (s/2, h/2)
          control = interpolate((s/2, -c/2), (0, h/2 - c), inout)
          radius = s
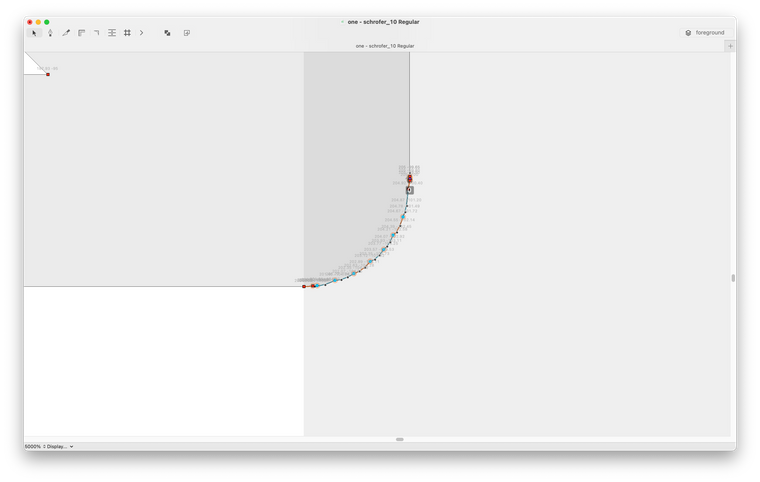
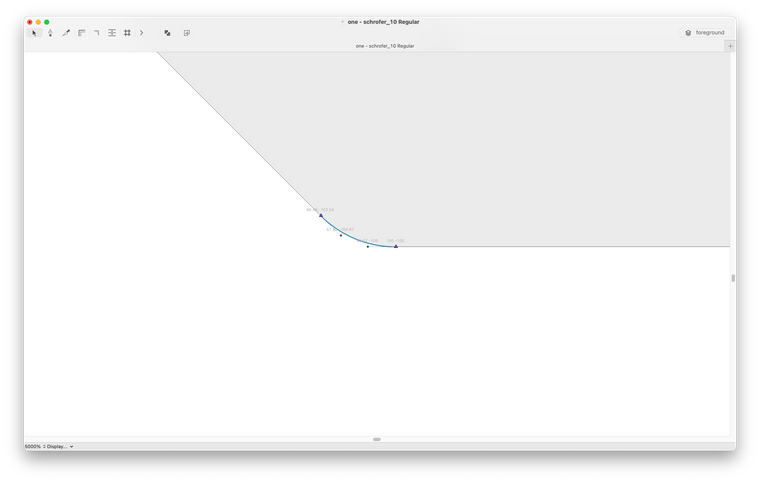
          # optimal distance to control points is (4/3)*tan(pi/(2n); thank you https://stackoverflow.com/users/16673/suma for answering this question https://stackoverflow.com/questions/1734745/how-to-create-circle-with-b%C3%A9zier-curves
          control_ratio = ((4/3 * tan(pi/12)) * radius) / (2 * c)
          controlP = interpolate(pivot, control, control_ratio)
          controlT = interpolate(target, control, control_ratio)
          triangle = BezierPath()
          triangle.moveTo(start)
          triangle.lineTo(pivot)
          triangle.curveTo(controlP, controlT, target)
          triangle.closePath()
          drawPath(triangle)
      
      def frame(x, y, m):
          f = BezierPath()
          g = BezierPath()
          f.rect(0, 0, x, y)
          g.rect(m, m, x - (2 * m), y - (2 * m))
          f = f.difference(g)
          f.closePath()
          drawPath(f)
      
      # original Riley plan for Rustle 6    
      plan = [
          [0, 0, 0, 0, 0, 0, 0, 0, 0, 0, 0, 0, 0],
          [0, 0, 0, 1, 0, 0, 0, -1, 0, 0, 0, 1, 0, 0],
          [-1, 0, -1, 0, 0, 0, 0, 0, 1, 0, -1, 0, 0],
          [1, 0, 1, -1, 0, 0, -1, 0, 0, 0, 1, 0, 1, 0],
          [0, -1, 0, -1, 0, 0, 0, 1, 0, -1, 0, -1, 0],
          [0, 1, -1, 1, 0, 1, 0, 0, 0, 0, -1, 1, 0, 0],
          [-1, 0, -1, 0, 0, 0, 0, 0, 0, 0, -1, 0, -1],
          [1, 0, 1, 0, 1, 0, 1, 0, 1, 0, 1, 0, 1, 0],
          [0, -1, 0, 0, 0, 0, 0, 0, 0, -1, 0, -1, 0],
          [0, -1, 0, 1, 0, 1, 0, 1, 0, 0, 0, 1, -1, 0],
          [-1, 0, -1, 0, 0, 0, 0, 0, 0, 0, -1, -1, -1],
          [-1, 0, -1, 0, 1, 0, 1, 0, 0, 0, 1, -1, -1, 0],
          [0, -1, 0, 0, 0, 0, 0, 0, 0, -1, 0, -1, -1, 0],
          [0, 0, 0, -1, 0, 0, 0, 0, 0, 0, 0, -1, 0, 0],
          [0, 0, 0, 0, 0, 0, 0, 0, 0, 0, 0, 0, 0],
          ]
      
      for n in range(nFrames):
          newPage(canvasX, canvasY)
          frameDuration(1/30)
          ex = sin(radians(n * (360/nFrames)))
          fill(1)
          rect(0, 0, canvasX, canvasY)
          with savedState():
              translate(canvasX/2, canvasY/2)
              fill(0)
              translate(-(nX - 1) * offsetX/2, (nY - 1) * offsetY/2)
              for i in range(nY):
                  with savedState():
                      translate(0, i * -offsetY)
                      if i % 2 == 0:
                          for j in range(nX - 1):
                              with savedState():
                                  translate(offsetX/2 + (j * offsetX), 0)
                                  triangle(side, height, center, .5 - (ex * (plan[i][j] * .5)))
                      else:
                          for j in range(nX):
                              with savedState():
                                  translate(j * offsetX, 0)
                                  triangle(side, height, center, .5 - (ex * (plan[i][j] * .5)))
          fill(1)
          frame(canvasX, canvasY, side/2)
      
      saveImage('~/Desktop/riley_tribute_test_01_%s.gif' %time)
      

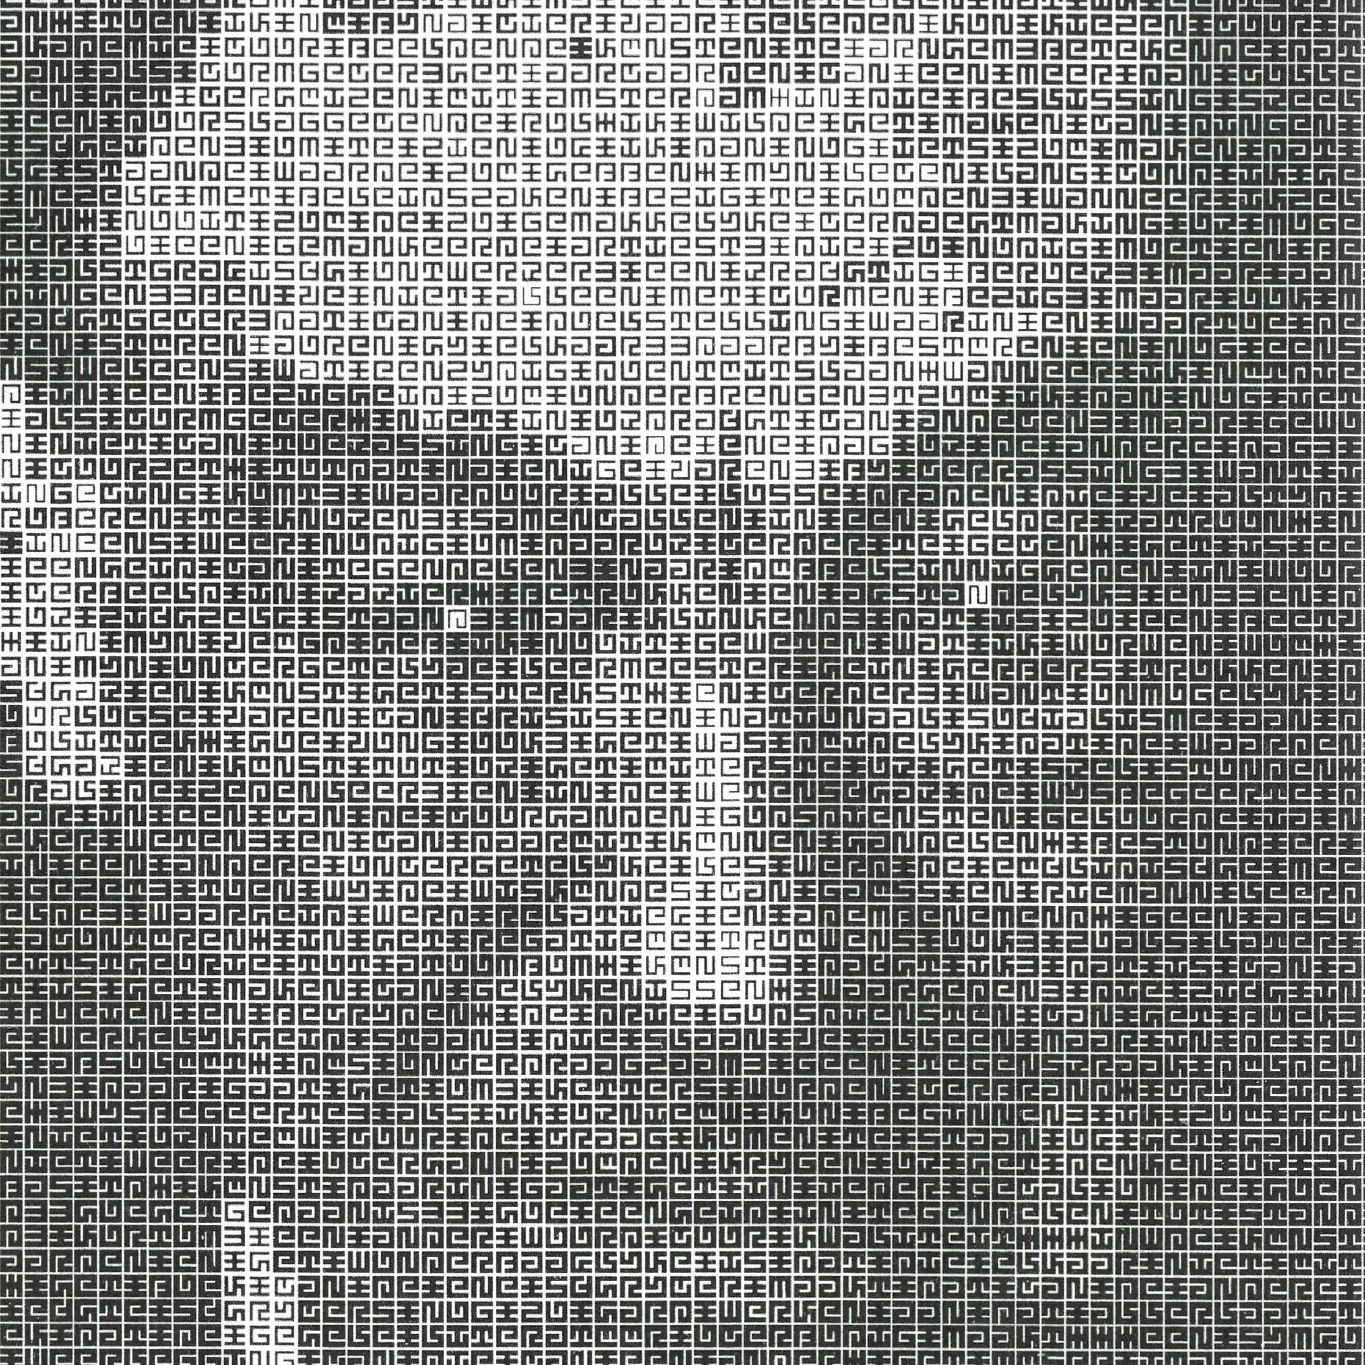
      The reference image:

      riley_rustle_6_2015.jpg

      posted in General Discussion
      MauriceMeilleur
      MauriceMeilleur
    • RE: Blobs 101?

      I mean to do so at some point—probably on GitHub, probably this summer when I can take a little time to clean up code and organize the sketches.

      posted in Code snippets
      MauriceMeilleur
      MauriceMeilleur
    • RE: Animated Müller-Lyer illusion

      And here's yet another—I forget the name of the illusion just now.

      canvas = 500 #750
      number = 15
      shape = canvas/15
      small = shape/2
      offset = shape
      nFrames = 90 #240
      r = 5
      
      def semi(pos, rot):
          s = BezierPath()
          if pos == 'top':
              s.arc((0, 0), shape/2, 0, 180, False)
          elif pos == 'bottom':
              s.arc((0, 0), shape/2, 0, 180, True)
          s.closePath()
          s.rotate(rot)
          drawPath(s)
          
      for n in range(nFrames):
          newPage(canvas, canvas)
          frameDuration(1/30)
          fill(.85)
          rect(0, 0, canvas, canvas)
          translate(canvas/2, canvas/2)
          save()
          translate(-(number - 1) * offset/2, (number - 1) * offset/2)
          fill(.2)
          for i in range(number):
              save()
              translate(0, i * -offset)
              if (i % 2) == 0:
                  v = 1
              elif (i % 2) == 1:
                  v = -1
              for j in range(number):
                  save()
                  translate(j * offset, 0)
                  if (j % 2) == 0:
                      semi('top', r * (sin((2 * pi) * (n/nFrames))) * v)
                  elif (j % 2) == 1:
                      semi('bottom', r * (sin((2 * pi) * (n/nFrames))) * v)
                  restore()
              restore()
          restore()
          translate(0, (number - 1) * offset/2)
          for i in range(number):
              save()
              translate(0, i * -offset)
              if (i % 2) == 0:
                  fill(1)
                  oval((cos((2 * pi) * (n/nFrames)) * canvas/2) - small/2, 0, small, small)
              elif (i % 2) == 1:
                  fill(1)
                  oval((cos((2 * pi) * (n/nFrames)) * -canvas/2) - small/2, 0, small, small)
              restore()
      saveImage('~/Desktop/op_semi_lines.gif')
      

      With both sketches, a larger canvas and more frames (240+) makes for a better effect.

      0_1541243183279_op_semi_lines.gif

      posted in Code snippets
      MauriceMeilleur
      MauriceMeilleur
    • RE: Animated Müller-Lyer illusion

      Here's code for another, the 'intertwining illusion'.

      canvas = 500
      nFrames = 60 #240
      size = canvas/36
      num1 = 60
      num2 = 44
      num3 = 30
      num4 = 14
      r = 15
      
      def mod(rot):
          m = BezierPath()
          m.rect(-size/2, -size/2, size, size)
          m.closePath()
          m.rotate(rot)
          drawPath(m)
          
      for n in range(nFrames):
          newPage(canvas, canvas)
          frameDuration(1/30)
          fill(.5)
          rect(0, 0, canvas, canvas)
          strokeWidth(3)
          translate(canvas/2, canvas/2)
          save()
          for i in range(num1):
              if i % 2 == 0:
                  stroke(1)
              else:
                  stroke(.15)
              save()
              translate(.8 * canvas/2, 0)
              mod(r * (sin(2 * pi * n/nFrames)))
              restore()
              rotate(360/num1)
          restore()
          save()
          for j in range(num2):
              if j % 2 == 0:
                  stroke(1)
              else:
                  stroke(.15)
              save()
              translate(.6 * canvas/2, 0)
              mod(-r * (sin(2 * pi * n/nFrames)))
              restore()
              rotate(360/num2)    
          restore()
          save()
          for k in range(num3):
              if k % 2 == 0:
                  stroke(1)
              else:
                  stroke(.15)
              save()
              translate(.4 * canvas/2, 0)
              mod(r * (sin(2 * pi * n/nFrames)))
              restore()
              rotate(360/num3)    
          restore()
          save()
          for l in range(num4):
              if l % 2 == 0:
                  stroke(1)
              else:
                  stroke(.15)
              save()
              translate(.2 * canvas/2, 0)
              mod(-r * (sin(2 * pi * n/nFrames)))
              restore()
              rotate(360/num4)    
          restore()
      
      saveImage('~/Desktop/opart_intertwine.gif')
      

      The more frames, the more subtle the shift.

      0_1541242665977_opart_intertwine.gif

      posted in Code snippets
      MauriceMeilleur
      MauriceMeilleur
    • RE: Blobs 101?

      Good news about the pen functionality—glad I saw that, it'll come in handy for a couple things I'm working on …

      posted in Code snippets
      MauriceMeilleur
      MauriceMeilleur
    • RE: Impossible typefaces?

      @michelangelo Ned, please feel free to email me at maurice@mauricemeilleur.net. This is a bit of a specialty of mine.

      posted in Code snippets
      MauriceMeilleur
      MauriceMeilleur

    Latest posts made by MauriceMeilleur

    • RE: The promise and perils of expandStroke()

      Update: this problem appears to be an artifact of combining and expanding two+ strokes in DrawBot. I only see this at corners where two adjacent closed paths are combined and expanded.

      posted in General Discussion
      MauriceMeilleur
      MauriceMeilleur
    • The promise and perils of expandStroke()

      Welp. Thought I’d skate through using expandStroke() for the Schrofer constructed script I’m currently digitizing in RoboFont, but I think I’ll be rolling my own instead.

      Screen Shot 2022-08-06 at 3.20.19 PM.png

      This doesn't happen consistently, by the way:

      Screen Shot 2022-08-06 at 3.32.22 PM.png

      posted in General Discussion
      MauriceMeilleur
      MauriceMeilleur
    • RE: Am I missing something from expandStroke() documentation?

      @monomonnik Oh, I see—I was treating it like a method. Thanks.

      posted in General Discussion
      MauriceMeilleur
      MauriceMeilleur
    • Am I missing something from expandStroke() documentation?

      Going to post this here under the assumption it's not a bug, it's me: am I missing anything in the documentation for expandStroke()? Because I can't seem to get it to work for me:

      Screen Shot 2022-06-23 at 6.51.55 PM.png

      posted in General Discussion
      MauriceMeilleur
      MauriceMeilleur
    • RE: FontTools, probably a simple question

      @frederik Oh, I see—I just needed to import (from) the right submodule. Thanks!

      posted in General Discussion
      MauriceMeilleur
      MauriceMeilleur
    • FontTools, probably a simple question

      I'd like to use the FontTools methods for finding arc length and finding points along a curve at https://github.com/fonttools/fonttools/blob/main/Lib/fontTools/misc/bezierTools.py#L98. I can import the fontTools module, but I don't seem to be able to use methods like calcCubicArcLength(). I guess I could just pull code out of the repo, but I'd rather use the functions from the module. What am I missing?

      posted in General Discussion
      MauriceMeilleur
      MauriceMeilleur
    • .svg resolution/units options for saveImage()

      Is it possible to add units and resolution as options for .svg export in saveImage()? I have a very niche reason for asking: I want to use exported .svg files with a plotter, and it might make the files easier to use if the units/resolution (effectively, scale) information in the .svg file.

      Specifically, I want to plot .svg outputs with an AxiDraw, and I'm having trouble convincing Inkscape that the files should be treated as 72dpi rather than stubbornly insisting (1) that they are sized in pixels, not DTP, and (2) that it should treat them as if they're 96ppi.

      posted in Feature Requests
      MauriceMeilleur
      MauriceMeilleur
    • Gaussian blur moves object when applied in different places in the code?

      Why does applying a Gaussian blur in different places in the code move the image it applies to? Example code, output, revised code putting the blur call before the 1st image, output.

      size(550, 300)
      # initiate a new image object
      im = ImageObject()
      # draw in the image
      # the 'with' statement will create a custom context
      # only drawing in the image object
      with im:
         # set a size for the image
         size(200, 200)
         # draw something
         fill(1, 0, 0)
         rect(0, 0, width(), height())
         fill(1)
         fontSize(30)
         text("Hello World", (10, 10))
      # draw in the image in the main context
      image(im, (10, 50))
      # apply some filters
      im.gaussianBlur()
      # get the offset (with a blur this will be negative)
      x, y = im.offset()
      # draw in the image in the main context
      image(im, (300+x, 50+y))
      

      yields:
      gaussian_test_01.jpg

      size(550, 300)
      # initiate a new image object
      im = ImageObject()
      # draw in the image
      # the 'with' statement will create a custom context
      # only drawing in the image object
      with im:
         # set a size for the image
         size(200, 200)
         # draw something
         fill(1, 0, 0)
         rect(0, 0, width(), height())
         fill(1)
         fontSize(30)
         text("Hello World", (10, 10))
      # apply some filters
      im.gaussianBlur()
      # draw in the image in the main context
      image(im, (10, 50))
      # get the offset (with a blur this will be negative)
      x, y = im.offset()
      # draw in the image in the main context
      image(im, (300+x, 50+y))
      

      yields:
      gaussian_test_02.jpg

      posted in Bugs
      MauriceMeilleur
      MauriceMeilleur