extracting anchor and control points in a variable font
-
Hi there
I have to reach out for real human natural intelligence - since the imaginary intelligence called AI is not able to help in this case.") thank you in advance!
thank you in advance!Issue: Difficulty extracting and drawing anchor and control points in a variable font using DrawBot.
Font: RobotoFlex VariableFont
Initial situation:
I want to extract and draw the anchor and control points of a variable font. I tried different approaches to extracting and plotting the points but kept running into problems. Here are the details of the attempts and the errors encountered:Script 1
# Set up canvas
canvas_width = 500
canvas_height = 500
txt = "H"
variable_font_path = "/Users/tobiasulrich/Downloads/Roboto_Flex/RobotoFlex-VariableFont_GRAD,XTRA,YOPQ,YTAS,YTDE,YTFI,YTLC,YTUC,opsz,slnt,wdth,wght.ttf"
fontSize = 400
point_size = 10  # Größere Punktgröße für bessere Sichtbarkeit

newPage(canvas_width, canvas_height)
fill(1)  # Weißer Hintergrund
rect(0, 0, canvas_width, canvas_height)
fill(0)  # Schwarzer Text
stroke(0)
strokeWidth(1)

# Create a FormattedString with the text and variable font
formattedString = FormattedString(txt, font=variable_font_path, fontSize=fontSize)

# Get the Bézier path of the text using FormattedString
path = BezierPath()
path.text(formattedString, (50, 50))

# Draw the text path
drawPath(path)

# Initialize lists to hold on-curve and off-curve points
on_curve_points = []
off_curve_points = []

# Iterate through contours and segments to extract points
output = ""
for contour in path.contours:
    for segment in contour:
        # Debug print to check the structure of the segment
        print("Segment:", segment)
        if hasattr(segment, 'points'):
            if segment.type == 'moveTo':
                x, y = segment.points[0]
                output += f"moveTo: ({x}, {y})\n"
                on_curve_points.append((x, y))
            elif segment.type == 'lineTo':
                x, y = segment.points[0]
                output += f"lineTo: ({x}, {y})\n"
                on_curve_points.append((x, y))
            elif segment.type == 'curveTo':
                cp1 = segment.points[0]
                cp2 = segment.points[1]
                pt = segment.points[2]
                output += f"curveTo: control point 1: ({cp1[0]}, {cp1[1]}), control point 2: ({cp2[0]}, {cp2[1]}), on-curve point: ({pt[0]}, {pt[1]})\n"
                off_curve_points.append((cp1[0], cp1[1]))
                off_curve_points.append((cp2[0], cp2[1]))
                on_curve_points.append((pt[0], pt[1]))

# Draw on-curve points
fill(1, 0, 0)  # Rot für on-curve Punkte
stroke(None)
for (x, y) in on_curve_points:
    print("Drawing on-curve point at:", x, y)
    oval(x - point_size / 2, y - point_size / 2, point_size, point_size)

# Draw off-curve points
fill(0, 1, 0)  # Grün für off-curve Punkte
stroke(None)
for (x, y) in off_curve_points:
    print("Drawing off-curve point at:", x, y)
    oval(x - point_size / 2, y - point_size / 2, point_size, point_size)

# Save the image
saveImage("H_with_anchor_points.png")

# Ausgabe der Koordinaten
print(output)
Error
Traceback (most recent call last):
  File "<untitled>", line 35, in <module>
AttributeError: 'list' object has no attribute 'type'
Script 2
# Set up canvas
canvas_width = 500
canvas_height = 500
txt = "O"
variable_font_path = "/Users/tobiasulrich/Downloads/Roboto_Flex/RobotoFlex-VariableFont_GRAD,XTRA,YOPQ,YTAS,YTDE,YTFI,YTLC,YTUC,opsz,slnt,wdth,wght.ttf"
fontSize = 400
point_size = 10  # Größere Punktgröße für bessere Sichtbarkeit

newPage(canvas_width, canvas_height)
fill(1)  # Weißer Hintergrund
rect(0, 0, canvas_width, canvas_height)
fill(0)  # Schwarzer Text
stroke(0)
strokeWidth(1)

# Create a FormattedString with the text and variable font
formattedString = FormattedString(txt, font=variable_font_path, fontSize=fontSize)

# Get the Bézier path of the text using FormattedString
path = BezierPath()
path.text(formattedString, (50, 50))

# Draw the text path
drawPath(path)

# Initialize lists to hold on-curve and off-curve points
on_curve_points = []
off_curve_points = []

# Iterate through contours and segments to extract points
for contour in path.contours:
    for segment in contour:
        # Debug print to check the structure of the segment
        print("Segment:", segment)
        if hasattr(segment, 'points'):
            if segment.type == 'moveTo':
                x, y = segment.points[0]
                print("moveTo:", x, y)
                on_curve_points.append((x, y))
            elif segment.type == 'lineTo':
                x, y = segment.points[0]
                print("lineTo:", x, y)
                on_curve_points.append((x, y))
            elif segment.type == 'curveTo':
                cp1 = segment.points[0]
                cp2 = segment.points[1]
                pt = segment.points[2]
                print("curveTo:", cp1, cp2, pt)
                off_curve_points.append(cp1)
                off_curve_points.append(cp2)
                on_curve_points.append(pt)

# Draw on-curve points
fill(1, 0, 0)  # Red for on-curve points
stroke(None)
for (x, y) in on_curve_points:
    print("Drawing on-curve point at:", x, y)
    oval(x - point_size / 2, y - point_size / 2, point_size, point_size)

# Draw off-curve points
fill(0, 1, 0)  # Green for off-curve points
stroke(None)
for (x, y) in off_curve_points:
    print("Drawing off-curve point at:", x, y)
    oval(x - point_size / 2, y - point_size / 2, point_size, point_size)

# Save the image
saveImage("O_with_anchor_points.png")
Error: No error, but no points visible
Konsole
Segment: [(79.296875, 50.0)]
Segment: [(81.25, 50.0)]
Segment: [(81.25, 197.265625)]
Segment: [(247.265625, 197.265625)]
Segment: [(247.265625, 50.0)]
Segment: [(249.21875, 50.0)]
Segment: [(249.21875, 334.375)]
Segment: [(247.265625, 334.375)]
Segment: [(247.265625, 198.828125)]
Segment: [(81.25, 198.828125)]
Segment: [(81.25, 334.375)]
Segment: [(79.296875, 334.375)]
Script 3
# Set up canvas
canvas_width = 500
canvas_height = 500
txt = "H"
variable_font_path = "/Library/Fonts/RobotoFlex-VariableFont_GRAD,XTRA,YOPQ,YTAS,YTDE,YTFI,YTLC,YTUC,opsz,slnt,wdth,wght.ttf"
font_size = 400

# Neue Seite erstellen und Hintergrund setzen
newPage(canvas_width, canvas_height)
fill(1)  # Weißer Hintergrund
rect(0, 0, canvas_width, canvas_height)
fill(0)  # Schwarzer Text

# Schriftart setzen und prüfen, ob sie korrekt geladen wird
font(variable_font_path)
fontSize(font_size)

# Alle Achsen der aktuellen Schriftart auflisten
variations = listFontVariations()
for axis, data in variations.items():
    print(f"Axis: {axis}, Data: {data}")

# Eine Variation der aktuellen Schriftart auswählen
if 'wght' in variations:
    fontVariations(wght=500)

# Create a FormattedString with the text and variable font
formattedString = FormattedString(txt, font=variable_font_path, fontSize=font_size)

# Get the Bézier path of the text using FormattedString
path = BezierPath()
path.text(formattedString, (50, 50))

# Initialize lists to hold on-curve and off-curve points
on_curve_points = []
off_curve_points = []

# Iterate through contours and segments to extract points
output = ""
for contour in path.contours:
    for segment in contour:
        # Debug print to check the structure of the segment
        if hasattr(segment, 'points'):
            points = segment.points
            if segment.type == 'moveTo':
                x, y = points[0]
                output += f"moveTo: ({x}, {y})\n"
                on_curve_points.append((x, y))
            elif segment.type == 'lineTo':
                x, y = points[0]
                output += f"lineTo: ({x}, {y})\n"
                on_curve_points.append((x, y))
            elif segment.type == 'curveTo':
                cp1 = points[0]
                cp2 = points[1]
                pt = points[2]
                output += f"curveTo: control point 1: ({cp1[0]}, {cp1[1]}), control point 2: ({cp2[0]}, {cp2[1]}), on-curve point: ({pt[0]}, {pt[1]})\n"
                off_curve_points.append((cp1[0], cp1[1]))
                off_curve_points.append((cp2[0], cp2[1]))
                on_curve_points.append((pt[0], pt[1]))

# Draw on-curve points
fill(1, 0, 0)  # Rot für on-curve Punkte
stroke(None)
for (x, y) in on_curve_points:
    print("Drawing on-curve point at:", x, y)
    oval(x - point_size / 2, y - point_size / 2, point_size, point_size)

# Draw off-curve points
fill(0, 1, 0)  # Grün für off-curve Punkte
stroke(None)
for (x, y) in off_curve_points:
    print("Drawing off-curve point at:", x, y)
    oval(x - point_size / 2, y - point_size / 2, point_size, point_size)

# Save the image
saveImage("H_with_anchor_points.png")

# Ausgabe der Koordinaten
print(output)
Error
Traceback (most recent call last):
  File "<untitled>", line 42, in <module>
AttributeError: 'list' object has no attribute 'type'
-
Not sure if this is completely correct and robust enough for what you need, but it works. At least for H and O.
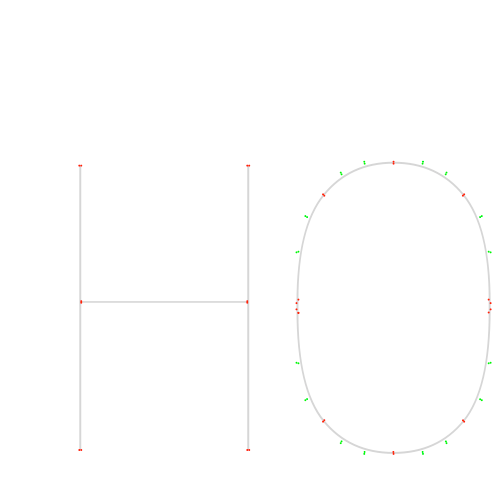
# Set up canvas
canvas_width = 500
canvas_height = 500
txt = "HO"
variable_font_path = "RobotoFlex-VariableFont_GRAD,XOPQ,XTRA,YOPQ,YTAS,YTDE,YTFI,YTLC,YTUC,opsz,slnt,wdth,wght.ttf"
font_size = 400
point_size = 2

# Neue Seite erstellen und Hintergrund setzen
newPage(canvas_width, canvas_height)
fill(1)  # Weißer Hintergrund
rect(0, 0, canvas_width, canvas_height)
fill(0)  # Schwarzer Text

# Schriftart setzen und prüfen, ob sie korrekt geladen wird
font(variable_font_path)
fontSize(font_size)

# Alle Achsen der aktuellen Schriftart auflisten
variations = listFontVariations()
# for axis, data in variations.items():
#     print(f"Axis: {axis}, Data: {data}")

# Eine Variation der aktuellen Schriftart auswählen
if 'wght' in variations:
    fontVariations(wght=500)

# Create a FormattedString with the text and variable font
formattedString = FormattedString(txt, font=variable_font_path, fontSize=font_size)

# Get the Bézier path of the text using FormattedString
path = BezierPath()
path.text(formattedString, (50, 50))
with savedState():
    fill(.8)
    drawPath(path)

# Initialize lists to hold on-curve and off-curve points
on_curve_points = []
off_curve_points = []

# Iterate through contours and segments to extract points
output = ""
for contour in path.contours:
    # moveTo
    x, y = contour[0][0]
    on_curve_points.append((x, y))
    for segment in contour[1:]:
        if len(segment) == 1:
            # lineTo
            pt = segment[0]
            on_curve_points.append((pt[0], pt[1]))
        if len(segment) == 3:
            # curveTo
            cp1 = segment[0]
            cp2 = segment[1]
            pt = segment[2]
            off_curve_points.append((cp1[0], cp1[1]))
            off_curve_points.append((cp2[0], cp2[1]))
            on_curve_points.append((pt[0], pt[1]))

# Draw on-curve points
fill(1, 0, 0)  # Rot für on-curve Punkte
stroke(None)
for (x, y) in on_curve_points:
    print("Drawing on-curve point at:", x, y)
    oval(x - point_size / 2, y - point_size / 2, point_size, point_size)

# Draw off-curve points
fill(0, 1, 0)  # Grün für off-curve Punkte
stroke(None)
for (x, y) in off_curve_points:
    print("Drawing off-curve point at:", x, y)
    oval(x - point_size / 2, y - point_size / 2, point_size, point_size)

# Save the image
saveImage("H_with_anchor_points.png")

# Ausgabe der Koordinaten
print(output)
-
I think you ask for something from DrawBot that is not there.
formattedString = FormattedString('HO', font='Helvetica', fontSize=700)
# Get the Bézier path of the text using FormattedString
path = BezierPath()
path.text(formattedString, (50, 50))
# Draw the bezier path with the formatted string
newPage()
with savedState():
    fill(.8)
    drawPath(path)
# A segment of a DrawBot contour doesn’t have an attribute ‘points’ or ‘type’
for contour in path.contours:
    for segment in contour:
        print(segment) # returns list with point(s)
        print(type(segment)) # returns ‘<class 'list'>’
        # print(segment.points) # returns AttributeError: 'list' object has no attribute 'points'
        # print(segment.type) # returns AttributeError: 'list' object has no attribute 'type'
        if hasattr(segment, 'points'):
            # Will never be true
            print(segment.points)
-
Thank you @mmonomonnik ! Your sample code helped solving the issue I was facing with correctly visualizing the on-curve and off-curve points for a variable font.
Me and my imaginary friend now got the correct method for extracting and differentiating between on-curve and off-curve pointsand are able to correctly identifying and iterating through the segments of each contour. An important fix was ensuring that lines were drawn only between appropriate points, avoiding unnecessary connections that had previously cluttered the visualization.!
-
Nice! Thanks for sharing the result.