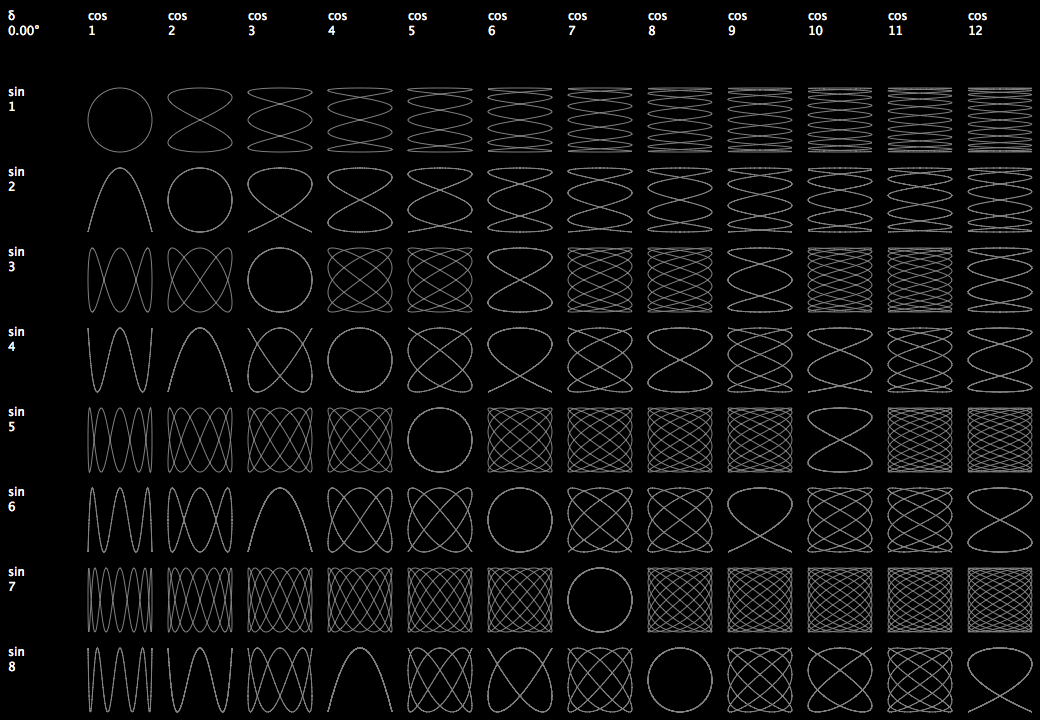
Lissajous table
-
Here is some code to draw a Lissajous table.
Change thefunc_xand/orfunc_y(sin or cos) and/or add some value to thedeltato get other curves.
Well, actually the curves are just polygons.# ---------------------- # lissajous table # ---------------------- # settings cols = 12 rows = 8 cell_s = 80 r_factor = .8 # fraction of the cell size to have a gap between them func_x = cos # should be `sin` or `cos` func_y = sin # should be `sin` or `cos` delta = 0 #pi/3 # some angle in radians density = 360 # amount of points per cell – higher values make nicer curve approximations # ---------------------- # calculated settings radius = (cell_s * r_factor) / 2 step = (2 * pi) / density pw = cell_s * (cols + 1) ph = cell_s * (rows + 1) x_coords = { (col, d) : func_x(step * (col + 1) * d + pi/2 + delta) * radius for col in range(cols) for d in range(density) } y_coords = { (row, d) : func_y(step * (row + 1) * d + pi/2) * radius for row in range(rows) for d in range(density) } # ---------------------- # function(s) def draw_cell(pos, col, row): cx, cy = pos points = [(cx + x_coords[(col, f)], cy + y_coords[(row, f)]) for f in range(density)] polygon(*points) # ---------------------- # drawings newPage(pw, ph) rect(0, 0, pw, ph) fontSize(12) translate(0, ph) fill(1) text('δ\n{0:.2f}°'.format(degrees(delta)), (cell_s * (1 - r_factor)/2, -20)) for col in range(1, cols+1): cx = col * cell_s + cell_s * (1 - r_factor)/2 text('{0}\n{1}'.format(func_x.__name__, col), (cx, -20)) for row in range(1, rows + 1): cy = row * cell_s + cell_s * (1 - r_factor) text('{0}\n{1}'.format(func_y.__name__, row), (cell_s * (1 - r_factor)/2, -cy)) fill(None) stroke(.5) strokeWidth(1) for col in range(cols): for row in range(rows): draw_cell((cell_s * col + cell_s * 1.5, - cell_s * row -cell_s * 1.5), col, row)