Navigation

    • Register
    • Login
    • Search
    • Categories
    • Recent
    • Tags
    • Users
    • Groups
    • Solved
    • Unsolved
    • Search
    1. Home
    2. roberto-arista
    3. Posts
    • Profile
    • Following
    • Followers
    • Topics
    • Posts
    • Best
    • Groups

    Posts made by roberto-arista

    • How to draw a wiggle line with Python

      Last year I wrote a Drawbot tutorial on Medium.
      If you want to jump directly into the code, here's the source:

      ##############################
      # Draw Wiggles using Drawbot #
      ##############################
      
      """
      Script by Roberto Arista, you can find the related tutorial here: https://medium.com/@roberto_arista/how-to-draw-a-wiggle-between-two-points-with-python-and-drawbot-788006c18fb0
      You can find drawbot here: http://www.drawbot.com/
      Code distributed with no guarantee, use at your own risk
      """
      
      ### Modules
      from math import radians, atan2, sqrt, sin, cos
      from collections import namedtuple
      
      
      ### Constants
      BLACK = (0, 0, 0)
      Point = namedtuple('Point', ['x', 'y'])
      
      
      ### Function & procedures
      def calcAngle(pt1, pt2):
          return atan2((pt2.y - pt1.y), (pt2.x - pt1.x))
      
      
      def calcDistance(pt1, pt2):
          return sqrt((pt1.x - pt2.x)**2 + (pt1.y - pt2.y)**2)
      
      
      def calcWiggle(pt1, pt2, waveLength, waveHeight, curveSquaring=.57):
          assert 0 <= curveSquaring <= 1, 'curveSquaring should be a value between 0 and 1: {}'.format(curveSquaring)
          assert waveLength > 0, 'waveLength smaller or equal to zero: {}'.format(waveLength)
      
          diagonal = calcDistance(pt1, pt2)
          angleRad = calcAngle(pt1, pt2)
      
          howManyWaves = diagonal//int(waveLength)
          waveInterval = diagonal/float(howManyWaves)
          maxBcpLength = sqrt((waveInterval/4.)**2+(waveHeight/2.)**2)
          bcpLength = maxBcpLength*curveSquaring
          bcpInclination = calcAngle(Point(0,0), Point(waveInterval/4., waveHeight/2.))
      
          wigglePoints = [pt1]
          prevFlexPt = pt1
          polarity = 1
          for waveIndex in range(0, int(howManyWaves*2)):
              bcpOutAngle = angleRad+bcpInclination*polarity
              bcpOut = Point(prevFlexPt.x+cos(bcpOutAngle)*bcpLength, prevFlexPt.y+sin(bcpOutAngle)*bcpLength)
      
              flexPt = Point(prevFlexPt.x+cos(angleRad)*waveInterval/2., prevFlexPt.y+sin(angleRad)*waveInterval/2.)
      
              bcpInAngle = angleRad+(radians(180)-bcpInclination)*polarity
              bcpIn = Point(flexPt.x+cos(bcpInAngle)*bcpLength, flexPt.y+sin(bcpInAngle)*bcpLength)
      
              wigglePoints.append((bcpOut, bcpIn, flexPt))
      
              polarity *= -1
              prevFlexPt = flexPt
      
          return wigglePoints
      
      
      def drawCurvesSequence(wigglePoints):
          myBez = BezierPath()
          myBez.moveTo(wigglePoints[0])
          for eachBcpOut, eachBcpIn, eachAnchor in wigglePoints[1:]:
              myBez.curveTo(eachBcpOut, eachBcpIn, eachAnchor)
          myBez.endPath()
          drawPath(myBez)
      
      
      ### Variables
      pt1 = Point(50, 50)
      pt2 = Point(150, 60)
      
      ### Instructions
      size(400, 400)
      
      oval(pt1.x-1, pt1.y-1, 2, 2)
      oval(pt2.x-1, pt2.y-1, 2, 2)
      
      stroke(*BLACK)
      strokeWidth(.5)
      fill(None)
      
      wigglePoints = calcWiggle(pt1, pt2, 16, 36, .7)
      drawCurvesSequence(wigglePoints)
      
      posted in Tutorials
      roberto-arista
      roberto-arista
    • Nested loops for 2d matrix pattern

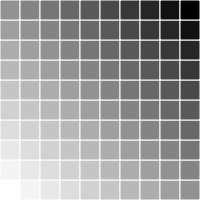
      Nested loops are the easiest way to draw 2d matrix patterns.
      I like to use the external loop for rows and the internal loop for columns. Someone told me once (yeah, I know, it's vague) that it is somehow a convention.

      The grayscale value is the sum of the cell indexes (vertical and horizontal) divided by the sum of the total amount of columns and rows (minus two because ranges start from zero)

      Here an example where they are combined with matrix transformations:

      cols = 10
      rows = 10
      
      size(200, 200)
      stroke(1)
      
      cellWdt = width()/cols
      cellHgt = height()/rows
      
      for eachRow in range(rows):
          save()
          for eachCol in range(cols):
              grayscale = 1-(eachRow+eachCol)/(rows+cols-2)
              fill(grayscale)
              rect(0, 0, cellWdt, cellHgt)
              translate(cellWdt, 0)
          restore()
          translate(0, cellHgt)
      

      resulting in

      0_1517913718176_forum.jpg

      👋 👋 👋

      posted in Code snippets
      roberto-arista
      roberto-arista
    • RE: Statistics module from py3

      🎉 🎉 🎉

      posted in Feature Requests
      roberto-arista
      roberto-arista
    • Statistics module from py3

      hey there!

      I just stumbled upon this new module of py3: statistics.
      It is a nice palette of calculation tools, it could be useful for data visualization.

      Would you think about including it in the next build?
      😬 😬 😬

      Cheers

      posted in Feature Requests
      roberto-arista
      roberto-arista