Hey @monomonnik
The problem is, that the rose is made of a single path and not two overlapping objects. I hoped there is some kind of a blend mode to clear overlapping colors.
Posts made by habakuk
-
RE: Even-Odd Fill Ruleposted in General Discussion
-
Even-Odd Fill Ruleposted in General Discussion
Subject: Help Needed with Even-Odd Fill Rule for Maurer Rose Animation
Hello DrawBot Community,
Me and my imaginary friend (AI) are reaching out for human intellignce once again.
 I'm currently working on creating an animated Moire Effect based on a Maurer Rose using DrawBot and have encountered an issue with applying the even-odd fill rule. The animation is supposed to alternate fills correctly to mimic the visual effect seen in examples like the one on this website. https://www.sqrt.ch/Buch/Maurer/maurerrosesanim.html However, doe to the missing even-odd filling rule, we haven't been able to achieve the desired effect.
Here's what I’ve tried so far:
Initial Attempt Without Even-Odd Fill Rule: (be carefull running this script, it takes ages to render. reduce the z variable to a low prime number)
# Parameters for the Maurer Rose
n = 5
d = 1
z = 853
ms = 90
dStroke = 1
dFarbe = (0, 0, 1)  # Blue stroke color
cFarbe = (1, 0, 0)  # Red fill color

newDrawing()

for frame in range(z):
    newPage(1010, 1010)
    frameDuration(ms / 1000)
    translate(width() / 2, height() / 2)

    fill(0)
    rect(-width() / 2, -height() / 2, width(), height())

    path = BezierPath()
    for theta in range(z + 1):
        k = (theta * d * 2 * pi) / z
        r = -500 * sin(n * k)
        x = r * cos(k)
        y = r * sin(k)
        if theta == 0:
            path.moveTo((x, y))
        else:
            path.lineTo((x, y))

    path.closePath()

    fill(*cFarbe)
    drawPath(path)

    stroke(*dFarbe)
    strokeWidth(dStroke)
    lineJoin('round')
    drawPath(path)

    d += 1

saveImage("maurer_rose_animation.gif")
endDrawing()
Attempt Without Unsupported Methods:
# Draw the fill and stroke
def draw_maurer_rose(d, n, z, dStroke, dFarbe, cFarbe):
    path = BezierPath()
    for theta in range(z + 1):
        k = (theta * d * 2 * pi) / z
        r = -500 * sin(n * k)
        x = r * cos(k)
        y = r * sin(k)
        if theta == 0:
            path.moveTo((x, y))
        else:
            path.lineTo((x, y))
    path.closePath()

    fill(*cFarbe)
    drawPath(path)

    stroke(*dFarbe)
    strokeWidth(dStroke)
    lineJoin('round')
    drawPath(path)

# Animation loop
for frame in range(z):
    newPage(1010, 1010)
    frameDuration(ms / 1000)
    translate(width() / 2, height() / 2)

    fill(1)
    rect(-width() / 2, -height() / 2, width(), height())

    draw_maurer_rose(d, n, z, dStroke, dFarbe, cFarbe)

    d += 1

saveImage("maurer_rose_animation.gif")
endDrawing()
...despite several attempts, I haven't been able to achieve the desired even-odd fill rule effect. I would appreciate any guidance or suggestions on how to properly implement the even-odd fill rule for this animation in DrawBot.
Thank you in advance for your help!
-
RE: extracting anchor and control points in a variable fontposted in General Discussion
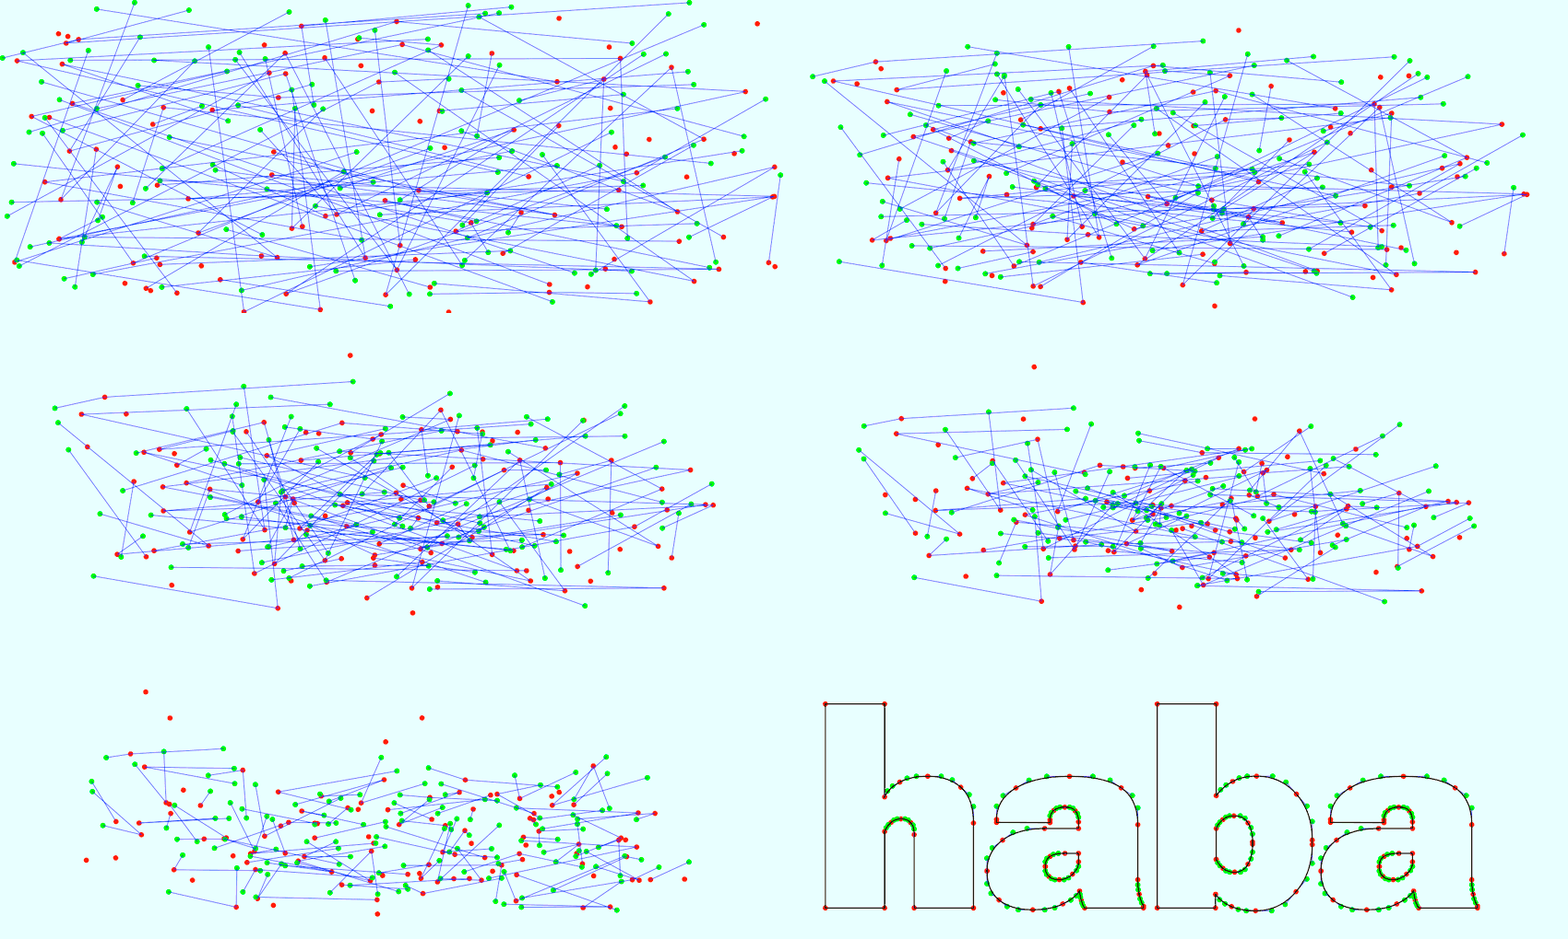
Thank you @mmonomonnik ! Your sample code helped solving the issue I was facing with correctly visualizing the on-curve and off-curve points for a variable font.
Me and my imaginary friend now got the correct method for extracting and differentiating between on-curve and off-curve pointsand are able to correctly identifying and iterating through the segments of each contour. An important fix was ensuring that lines were drawn only between appropriate points, avoiding unnecessary connections that had previously cluttered the visualization.!
-
extracting anchor and control points in a variable fontposted in General Discussion
Hi there
I have to reach out for real human natural intelligence - since the imaginary intelligence called AI is not able to help in this case. thank you in advance!
Issue: Difficulty extracting and drawing anchor and control points in a variable font using DrawBot.
Font: RobotoFlex VariableFont
Initial situation:
I want to extract and draw the anchor and control points of a variable font. I tried different approaches to extracting and plotting the points but kept running into problems. Here are the details of the attempts and the errors encountered:Script 1
# Set up canvas
canvas_width = 500
canvas_height = 500
txt = "H"
variable_font_path = "/Users/tobiasulrich/Downloads/Roboto_Flex/RobotoFlex-VariableFont_GRAD,XTRA,YOPQ,YTAS,YTDE,YTFI,YTLC,YTUC,opsz,slnt,wdth,wght.ttf"
fontSize = 400
point_size = 10  # Größere Punktgröße für bessere Sichtbarkeit

newPage(canvas_width, canvas_height)
fill(1)  # Weißer Hintergrund
rect(0, 0, canvas_width, canvas_height)
fill(0)  # Schwarzer Text
stroke(0)
strokeWidth(1)

# Create a FormattedString with the text and variable font
formattedString = FormattedString(txt, font=variable_font_path, fontSize=fontSize)

# Get the Bézier path of the text using FormattedString
path = BezierPath()
path.text(formattedString, (50, 50))

# Draw the text path
drawPath(path)

# Initialize lists to hold on-curve and off-curve points
on_curve_points = []
off_curve_points = []

# Iterate through contours and segments to extract points
output = ""
for contour in path.contours:
    for segment in contour:
        # Debug print to check the structure of the segment
        print("Segment:", segment)
        if hasattr(segment, 'points'):
            if segment.type == 'moveTo':
                x, y = segment.points[0]
                output += f"moveTo: ({x}, {y})\n"
                on_curve_points.append((x, y))
            elif segment.type == 'lineTo':
                x, y = segment.points[0]
                output += f"lineTo: ({x}, {y})\n"
                on_curve_points.append((x, y))
            elif segment.type == 'curveTo':
                cp1 = segment.points[0]
                cp2 = segment.points[1]
                pt = segment.points[2]
                output += f"curveTo: control point 1: ({cp1[0]}, {cp1[1]}), control point 2: ({cp2[0]}, {cp2[1]}), on-curve point: ({pt[0]}, {pt[1]})\n"
                off_curve_points.append((cp1[0], cp1[1]))
                off_curve_points.append((cp2[0], cp2[1]))
                on_curve_points.append((pt[0], pt[1]))

# Draw on-curve points
fill(1, 0, 0)  # Rot für on-curve Punkte
stroke(None)
for (x, y) in on_curve_points:
    print("Drawing on-curve point at:", x, y)
    oval(x - point_size / 2, y - point_size / 2, point_size, point_size)

# Draw off-curve points
fill(0, 1, 0)  # Grün für off-curve Punkte
stroke(None)
for (x, y) in off_curve_points:
    print("Drawing off-curve point at:", x, y)
    oval(x - point_size / 2, y - point_size / 2, point_size, point_size)

# Save the image
saveImage("H_with_anchor_points.png")

# Ausgabe der Koordinaten
print(output)
Error
Traceback (most recent call last):
  File "<untitled>", line 35, in <module>
AttributeError: 'list' object has no attribute 'type'
Script 2
# Set up canvas
canvas_width = 500
canvas_height = 500
txt = "O"
variable_font_path = "/Users/tobiasulrich/Downloads/Roboto_Flex/RobotoFlex-VariableFont_GRAD,XTRA,YOPQ,YTAS,YTDE,YTFI,YTLC,YTUC,opsz,slnt,wdth,wght.ttf"
fontSize = 400
point_size = 10  # Größere Punktgröße für bessere Sichtbarkeit

newPage(canvas_width, canvas_height)
fill(1)  # Weißer Hintergrund
rect(0, 0, canvas_width, canvas_height)
fill(0)  # Schwarzer Text
stroke(0)
strokeWidth(1)

# Create a FormattedString with the text and variable font
formattedString = FormattedString(txt, font=variable_font_path, fontSize=fontSize)

# Get the Bézier path of the text using FormattedString
path = BezierPath()
path.text(formattedString, (50, 50))

# Draw the text path
drawPath(path)

# Initialize lists to hold on-curve and off-curve points
on_curve_points = []
off_curve_points = []

# Iterate through contours and segments to extract points
for contour in path.contours:
    for segment in contour:
        # Debug print to check the structure of the segment
        print("Segment:", segment)
        if hasattr(segment, 'points'):
            if segment.type == 'moveTo':
                x, y = segment.points[0]
                print("moveTo:", x, y)
                on_curve_points.append((x, y))
            elif segment.type == 'lineTo':
                x, y = segment.points[0]
                print("lineTo:", x, y)
                on_curve_points.append((x, y))
            elif segment.type == 'curveTo':
                cp1 = segment.points[0]
                cp2 = segment.points[1]
                pt = segment.points[2]
                print("curveTo:", cp1, cp2, pt)
                off_curve_points.append(cp1)
                off_curve_points.append(cp2)
                on_curve_points.append(pt)

# Draw on-curve points
fill(1, 0, 0)  # Red for on-curve points
stroke(None)
for (x, y) in on_curve_points:
    print("Drawing on-curve point at:", x, y)
    oval(x - point_size / 2, y - point_size / 2, point_size, point_size)

# Draw off-curve points
fill(0, 1, 0)  # Green for off-curve points
stroke(None)
for (x, y) in off_curve_points:
    print("Drawing off-curve point at:", x, y)
    oval(x - point_size / 2, y - point_size / 2, point_size, point_size)

# Save the image
saveImage("O_with_anchor_points.png")
Error: No error, but no points visible
Konsole
Segment: [(79.296875, 50.0)]
Segment: [(81.25, 50.0)]
Segment: [(81.25, 197.265625)]
Segment: [(247.265625, 197.265625)]
Segment: [(247.265625, 50.0)]
Segment: [(249.21875, 50.0)]
Segment: [(249.21875, 334.375)]
Segment: [(247.265625, 334.375)]
Segment: [(247.265625, 198.828125)]
Segment: [(81.25, 198.828125)]
Segment: [(81.25, 334.375)]
Segment: [(79.296875, 334.375)]
Script 3
# Set up canvas
canvas_width = 500
canvas_height = 500
txt = "H"
variable_font_path = "/Library/Fonts/RobotoFlex-VariableFont_GRAD,XTRA,YOPQ,YTAS,YTDE,YTFI,YTLC,YTUC,opsz,slnt,wdth,wght.ttf"
font_size = 400

# Neue Seite erstellen und Hintergrund setzen
newPage(canvas_width, canvas_height)
fill(1)  # Weißer Hintergrund
rect(0, 0, canvas_width, canvas_height)
fill(0)  # Schwarzer Text

# Schriftart setzen und prüfen, ob sie korrekt geladen wird
font(variable_font_path)
fontSize(font_size)

# Alle Achsen der aktuellen Schriftart auflisten
variations = listFontVariations()
for axis, data in variations.items():
    print(f"Axis: {axis}, Data: {data}")

# Eine Variation der aktuellen Schriftart auswählen
if 'wght' in variations:
    fontVariations(wght=500)

# Create a FormattedString with the text and variable font
formattedString = FormattedString(txt, font=variable_font_path, fontSize=font_size)

# Get the Bézier path of the text using FormattedString
path = BezierPath()
path.text(formattedString, (50, 50))

# Initialize lists to hold on-curve and off-curve points
on_curve_points = []
off_curve_points = []

# Iterate through contours and segments to extract points
output = ""
for contour in path.contours:
    for segment in contour:
        # Debug print to check the structure of the segment
        if hasattr(segment, 'points'):
            points = segment.points
            if segment.type == 'moveTo':
                x, y = points[0]
                output += f"moveTo: ({x}, {y})\n"
                on_curve_points.append((x, y))
            elif segment.type == 'lineTo':
                x, y = points[0]
                output += f"lineTo: ({x}, {y})\n"
                on_curve_points.append((x, y))
            elif segment.type == 'curveTo':
                cp1 = points[0]
                cp2 = points[1]
                pt = points[2]
                output += f"curveTo: control point 1: ({cp1[0]}, {cp1[1]}), control point 2: ({cp2[0]}, {cp2[1]}), on-curve point: ({pt[0]}, {pt[1]})\n"
                off_curve_points.append((cp1[0], cp1[1]))
                off_curve_points.append((cp2[0], cp2[1]))
                on_curve_points.append((pt[0], pt[1]))

# Draw on-curve points
fill(1, 0, 0)  # Rot für on-curve Punkte
stroke(None)
for (x, y) in on_curve_points:
    print("Drawing on-curve point at:", x, y)
    oval(x - point_size / 2, y - point_size / 2, point_size, point_size)

# Draw off-curve points
fill(0, 1, 0)  # Grün für off-curve Punkte
stroke(None)
for (x, y) in off_curve_points:
    print("Drawing off-curve point at:", x, y)
    oval(x - point_size / 2, y - point_size / 2, point_size, point_size)

# Save the image
saveImage("H_with_anchor_points.png")

# Ausgabe der Koordinaten
print(output)
Error
Traceback (most recent call last): File "<untitled>", line 42, in <module> AttributeError: 'list' object has no attribute 'type' -
RE: How to mirror/flip a object?posted in General Discussion
Hallo @jo thanks alot - at the moment i use the lissajus only to create different nice looking loops. I changed the values as you suggested and of course it is working now and delivers a new nice looking loop.

I`d love to make some more loops with more "natural, subtle and slow" movements. I saw your great visualisations of the different variable font movements and hoped to create a custom path to do so - but i failed...if you like to play around with my very first 5 letter variable font (HABKU) you are very welcome. http://habaland.ch/images/habaroll8GX.ttf
i added the the plus and minus to avoid the font doing the whole move to the min and max, because the backgraound would be visible then. (but most likely i created only a mess
 ) and by the way, i hate the black circle i had to ad "behind the scene" - id love o have a cleaner solution.
...at the moment i am trying to figure out where to append the savedState() without messing everything up...
greetings from Bern
-
RE: How to mirror/flip a object?posted in General Discussion
# -------------------------- # imports import sys sys.path.append("..") from helper_functions import * # -------------------------- # settings p_w, p_h = 1000, 1000 margin = 40 dia = 4 steps = 600 # lissajous values a = 2 # 2, 3, 4 are decent values b = a + 1 delta = 0 # pi/2, pi/3, pi/4 f_name = "habaroll8" axes = ['wght', 'wdth'] # -------- axis1_min = listFontVariations(f_name)[axes[0]]['minValue'] axis1_def = listFontVariations(f_name)[axes[0]]['defaultValue'] axis1_max = listFontVariations(f_name)[axes[0]]['maxValue'] axis2_min = listFontVariations(f_name)[axes[1]]['minValue'] axis2_def = listFontVariations(f_name)[axes[1]]['defaultValue'] axis2_max = listFontVariations(f_name)[axes[1]]['maxValue'] axis_w = p_w - 2 * margin axis_h = p_h - 2 * margin def_x = map_val(axis1_def, axis1_min, axis1_max, 0, axis_w) def_y = map_val(axis2_def, axis2_min, axis2_max, 0, axis_h) # -------------------------- # functions def a_page(): newPage(p_w,p_h) fill(1) rect(0, 0, p_w, p_h) translate(margin, margin) fill(0.92, 0.90, 0.87) rect(0, 0, axis_w, axis_h) font(f_name) fontSize(820 ) # -------------------------- # Drawings pts = [] for st in range(steps): # newDrawing() a_page() angle = 2 * pi / steps * st x = .5 + .5 * sin( a * angle + delta ) y = .5 + .5 * sin( b * angle ) curr_axis1 = ip(axis1_min + 20, axis1_max - 20, x) curr_axis2 = ip(axis2_min + 20, axis2_max - 20, y) var_values = { axes[0] : curr_axis1, axes[1] : curr_axis2 } fontVariations(**var_values) #black ring to avoid the background "bleed through" fill(None) stroke(0) strokeWidth(60) oval(125, 95, 700, 700) # the black part (fake 3D) stroke(0) strokeWidth(4) fill(0) text('A', (axis_w/2, axis_h/8), align = 'center') # the pink blob letter stroke(None) fill(0.79, 0.52, 0.67) scale(x=1.25, y=1.25) translate(x=-95, y=-80) text('A', (axis_w/2, axis_h/8), align = 'center') # the blob shadow (would be great to have the shadow behind the pink blob!) fill(0) translate(-120, 110) scale(x=0.9, y=-.05) skew(25, 0) rotate(-3) text('A', (axis_w/2, axis_h/8), align = 'center') saveImage('lissajous_var_test12.gif') -
RE: How to mirror/flip a object?posted in General Discussion
Hey @jo - thank you very much! That was the issue - damn, i am still in trouble with the the basics. Actually i am pretty stoked to have you here responding, because i am messing around with your code...
 i`d love to ad different lissajous curves to my blobbish letters, and i hoped changing the numbers (a = 2 # 2, 3, 4 are decent values) would do the trick - but it does not really change that much - sometimes even the loop is not longer working. Would you mind having a look at my codemess? (i mean, your code - and my mess
  )
)
-
RE: How to mirror/flip a object?posted in General Discussion
Hello @ricardov Yes, i tried negative scaling, but it gives no result. It gives no error, but there is also nothing happening...
-
RE: How to mirror/flip a object?posted in General Discussion
My goal is to draw a shadow, so I have to mirror the letter. (i achieved scaling, skewing, but not flipping)
newPage(1000, 1000) font('Skia') fontSize(600) fill(0.79, 0.52, 0.67) text('A', (300, 200)) fill(0) scale(x=1, y=0.05) text('A', (300, 800)) -
How to mirror/flip a object?posted in General Discussion
Hello World, i have a struggle on a very simple task - how can i mirror/flip a bezier path object (or a text) horizontal and vertical?
thanks in advance
-
RE: stuck in the codeposted in Code snippets
Hello @gferreira
I know how to move the blob and the hole separately. (Last example in my first post) My question is, if there is any way to move a group of objects together? I like to have a blob with several holes that act as one object? (If I change the movement of the blob, the holes will change too).
Sorry, my english is not very good ...
-
RE: stuck in the codeposted in Code snippets
Hello @michelangelo
Thank you very much, your code is very inspiring. I played around and it moves just how it should - except the "hole". Can the hole somehow act related to the blob and move just as it would be a part of the blob? (clipping?)
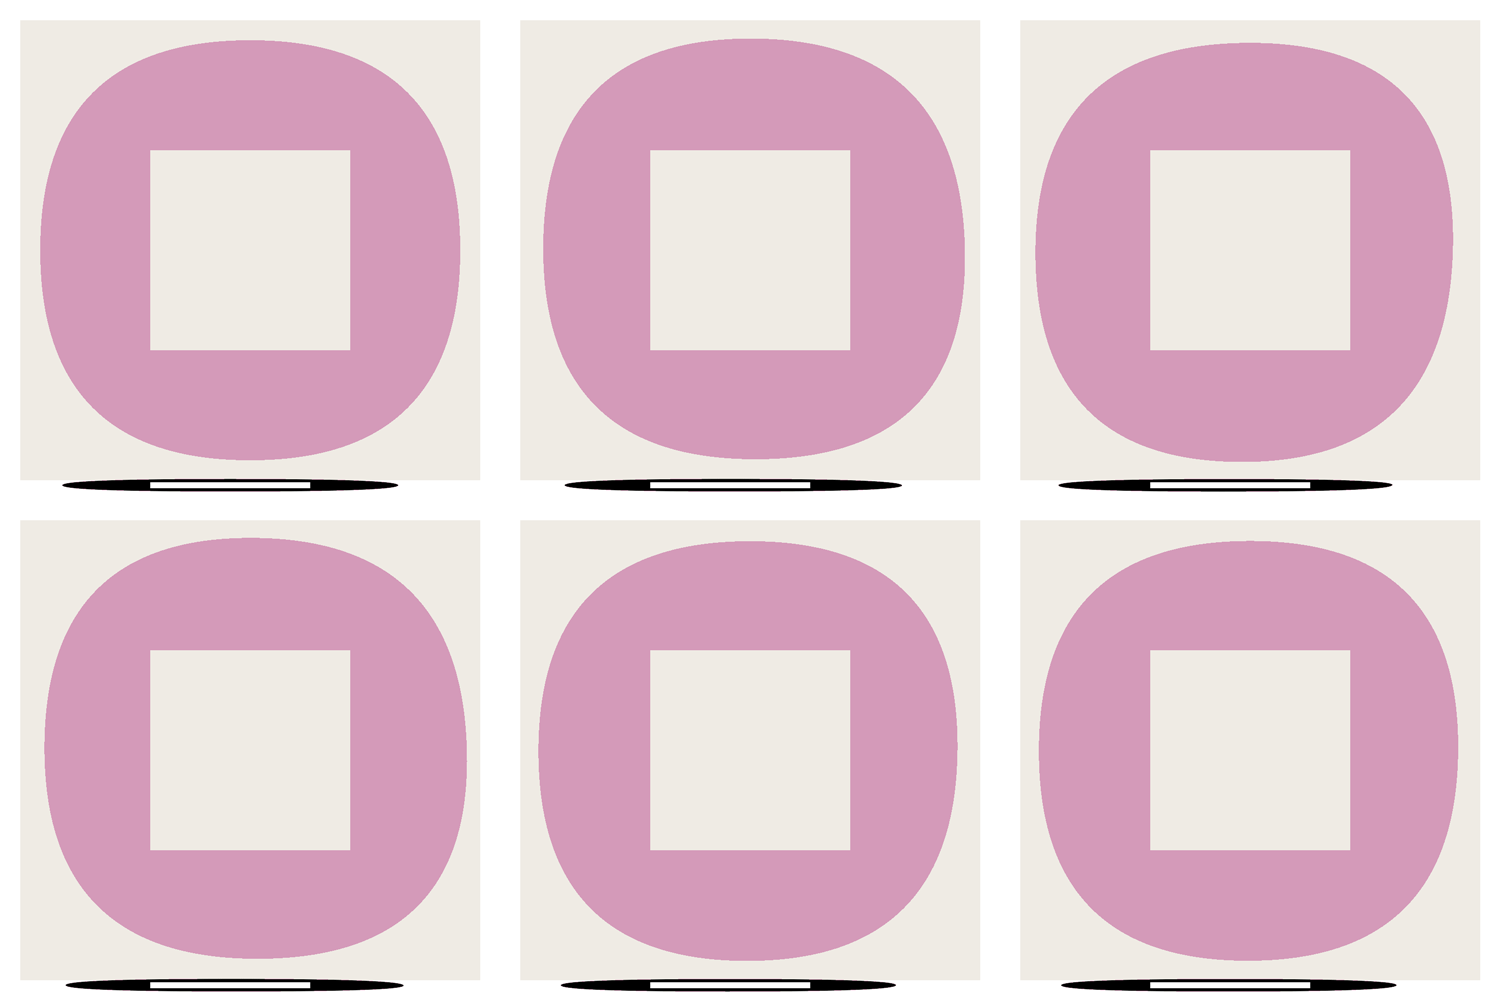
# Define a function to draw your shape def Blob(offset): # Let's make a Bezier Path shape bez = BezierPath() bez.qCurveTo((80 + offset, 80 + 0.2 * offset), (80 + offset, 920 + 0.8 * offset), (920 + 0.1 * offset, 920 + 0.3 * offset), (920 + 3 * offset, 80 + 0.5 * offset), None) # Here I make Another shape, but it's going the opposite direction bez.moveTo((700, 300)) bez.lineTo((700, 700)) bez.lineTo((300, 700)) bez.lineTo((300, 300)) bez.closePath() fill(0.79, 0.52, 0.67) stroke(None) drawPath(bez) translate(60, 15) scale(x=0.8, y=0.03) fill(0) # Drawing the shape here drawPath(bez) numFrames = 60 for i in range(numFrames): t = i / numFrames newPage(1000, 1000) fill(0.92, 0.90, 0.87) stroke(1) strokeWidth(80) rect(0, 0, 1000, 1000) # The function takes an argument "offset" to create the movement (it loops at * 50, * 25 * 12.5, * 6.25, 3.125 offset = sin(t * 12.5) * 10 print(offset) Blob(offset) saveImage("michelangelo_blob2.gif") -
RE: stuck in the codeposted in Code snippets
@michelangelo @michelangelo Heyho! Thank you so much for responding
 I had a whole mess of code in here, after a month or so with no reaction i deleted it - i felt ashamed, i thought my code mess must look hopeless to you guys. i will have a look at your example, and reupload some bits and pieces. Greetings
 -
RE: stuck in the codeposted in Code snippets
...beneath the "counter/holes" i am trying hard, to animate each cornerpoint (off line point) of the qcurve-path seperatly, to get e more irregular movement. I am open to every new inspiration from you guys, thanks in advance.
-
stuck in the codeposted in Code snippets
Hello World :::-)
Let me explain... I know nothing about code or coding.
As a graphic designer i am familiar with vector path, and i use to know some basics in html and css - just enough to have had a glimpse at the beauty of code, once upon a time late at night. Then i stumbled upon the drawbot app and id seems like the time has come for me to learn something new. Coding animations with drawbot/python.
I looked at the nice works you guys creating, played with your shared codes and had some succsess. I love to learn stuff by myself.
Soon i realised, that my recent all-pink procreate doodles probably can be animated. I found a nice Blob animation and somehow managed to create my own blob, with bits and parts of code. Have a look at my instagram: https://www.instagram.com/das_habakuk/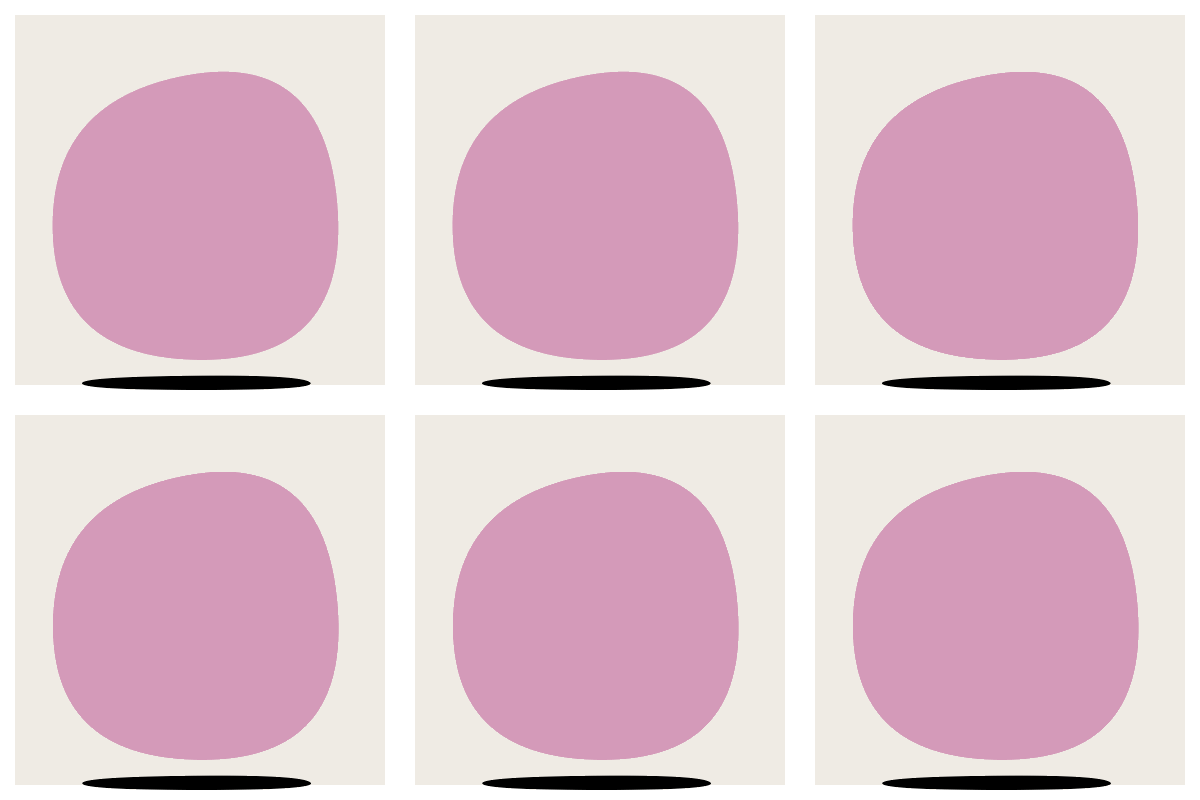
i turned the blob into my signature letter/character "H" and everthing seemed to be allright...
(
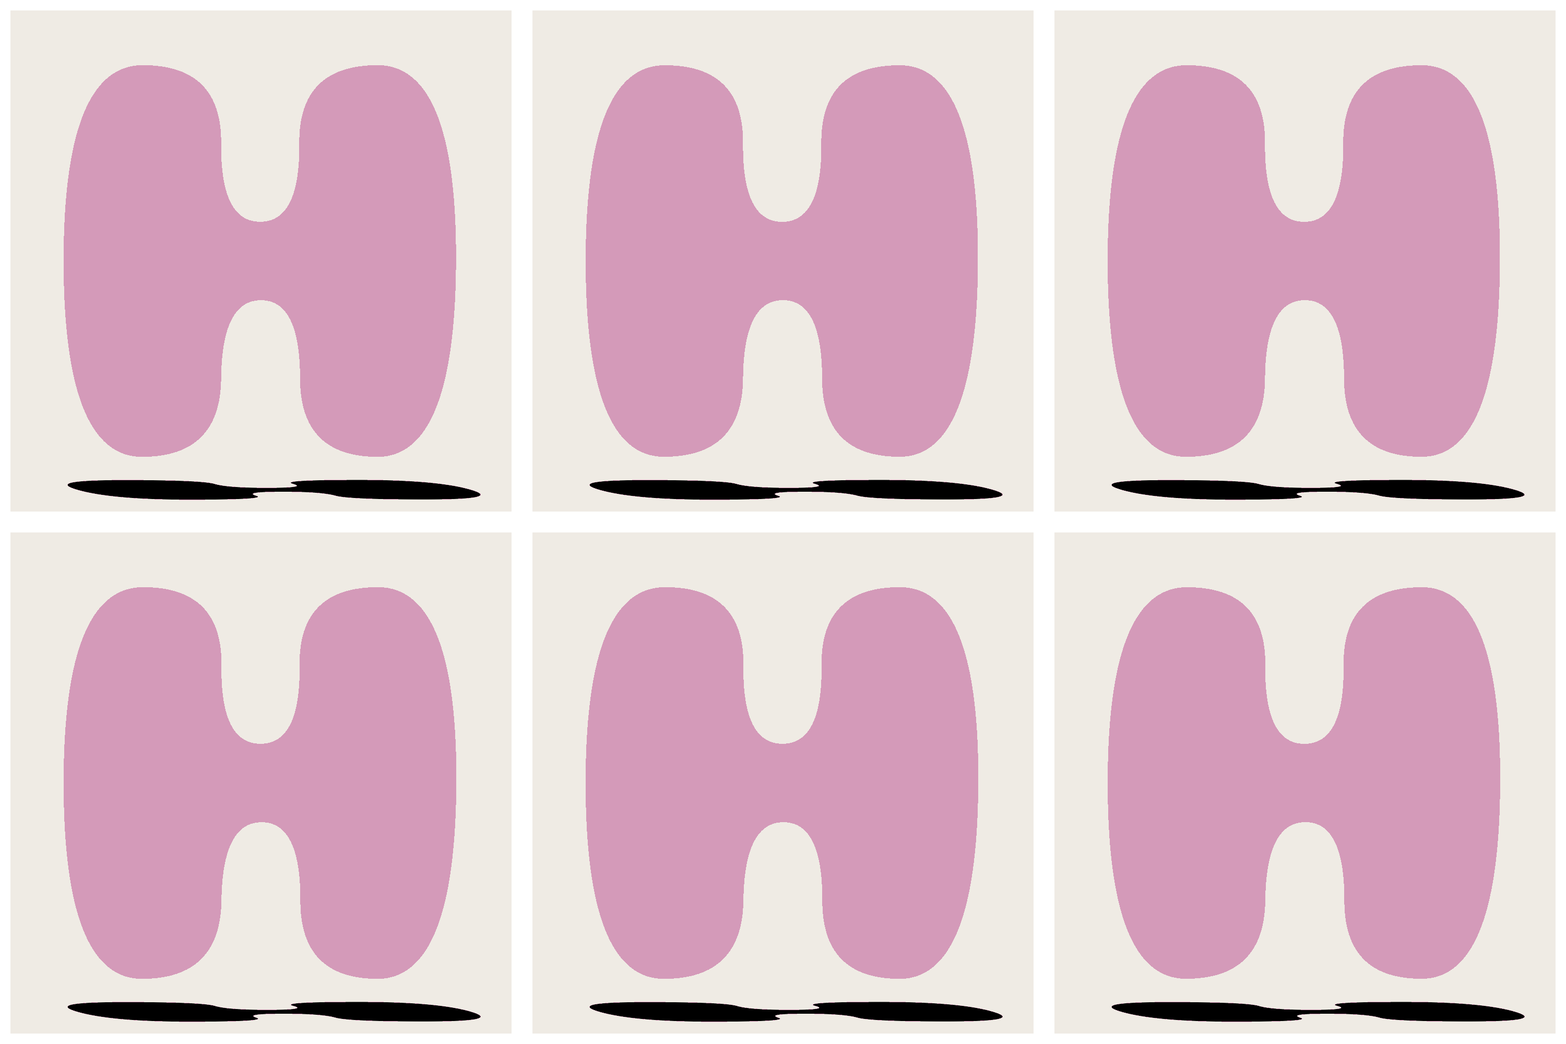
...and now it seems like i`m stuck - no more succsess, no more progression. I really dont like to share my beginner-codes, but maybe i have to do it.
i wrote that all, to let you know what my goals are - it is not possible to write down every single question i have. I try to dance my name, somehow. :::-)
I know, that several parts of my codes are useless, i figured out, that i dont need to import math and many other things. Altough, i havent managed yet, to fit the "counters" (holes) into my blob, to make it look like this:
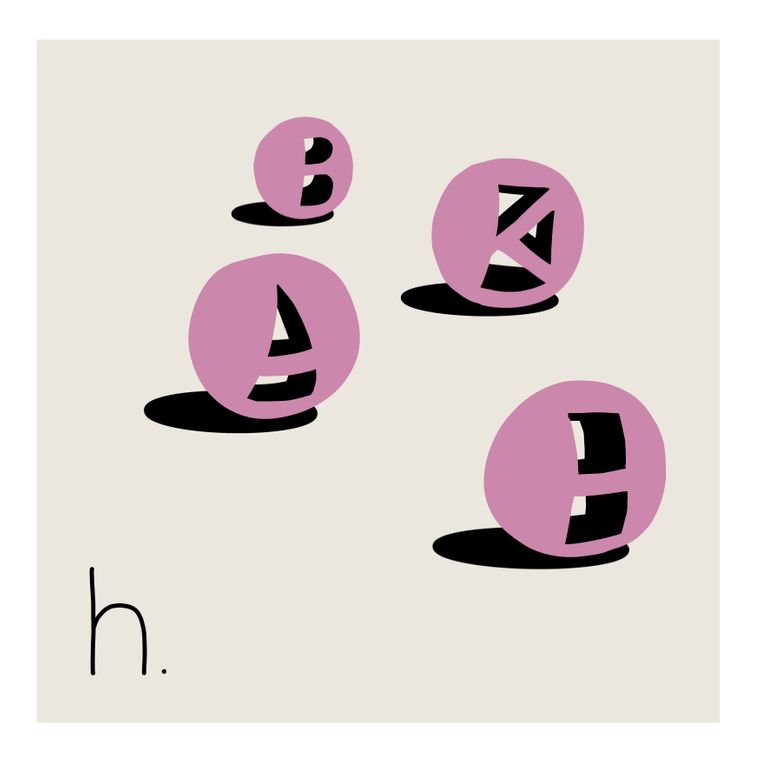
i managed to create two "counters/holes", and they even move, but they act like two little blobs, instead of being "clipped" to the movement of the main blob.
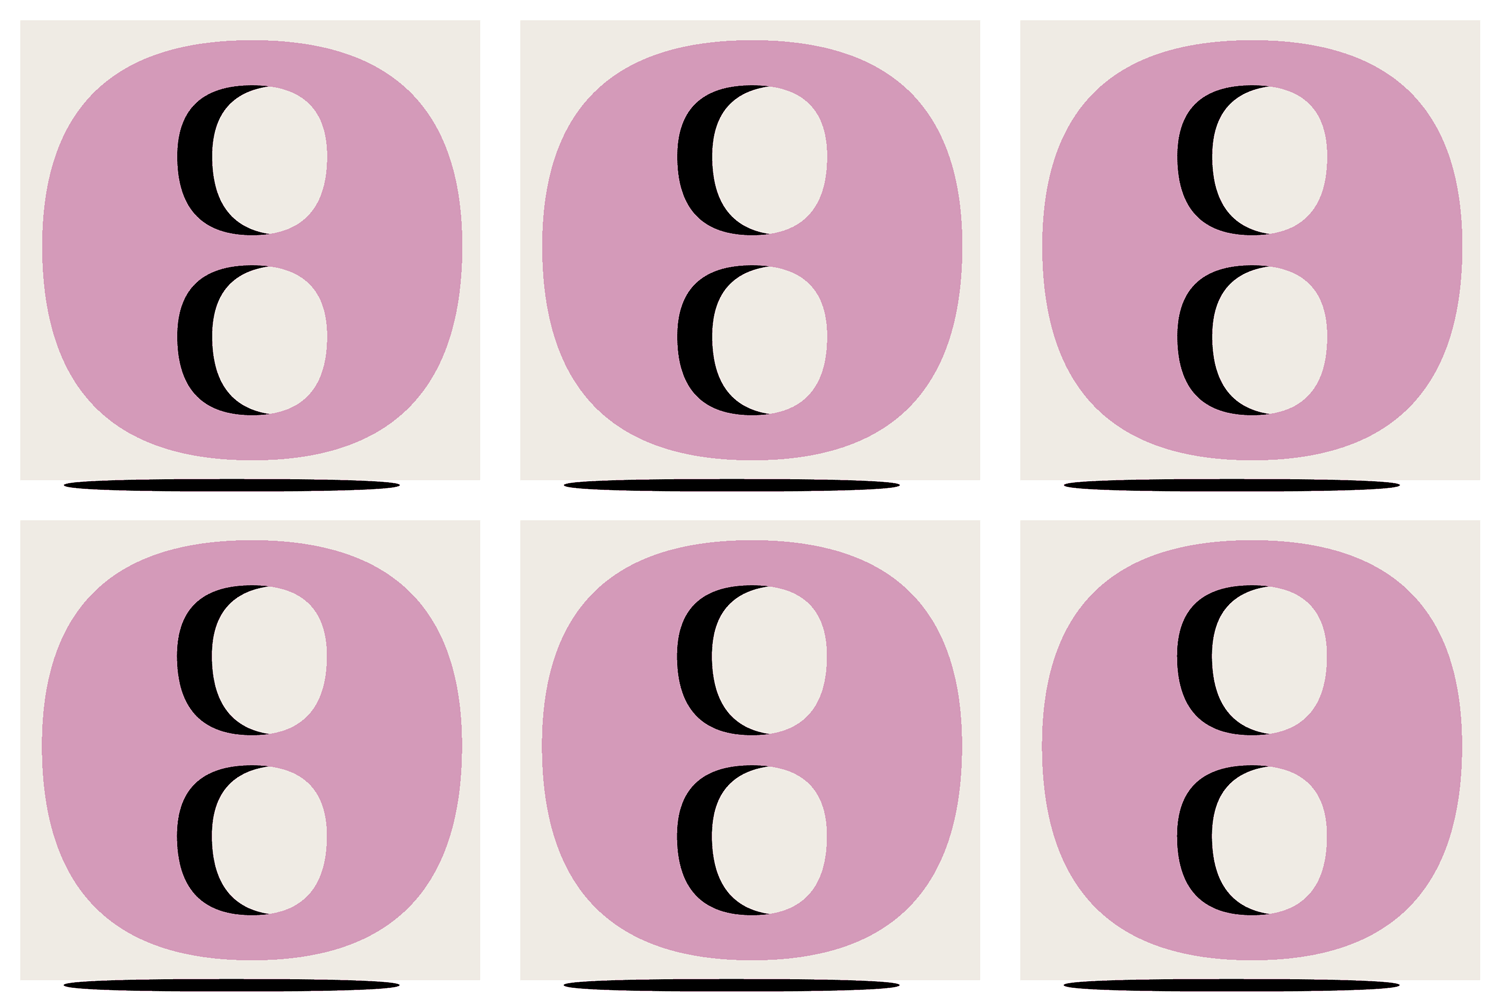
i know, for you guys this must be a terrible mess - please be kind!
thanks in andvance, greetings from switzerland
tobias aka. habakukedit: sorry, i posted in the wrong forum - this used to be in the "general discussion"