Interpolating Colorbars
-
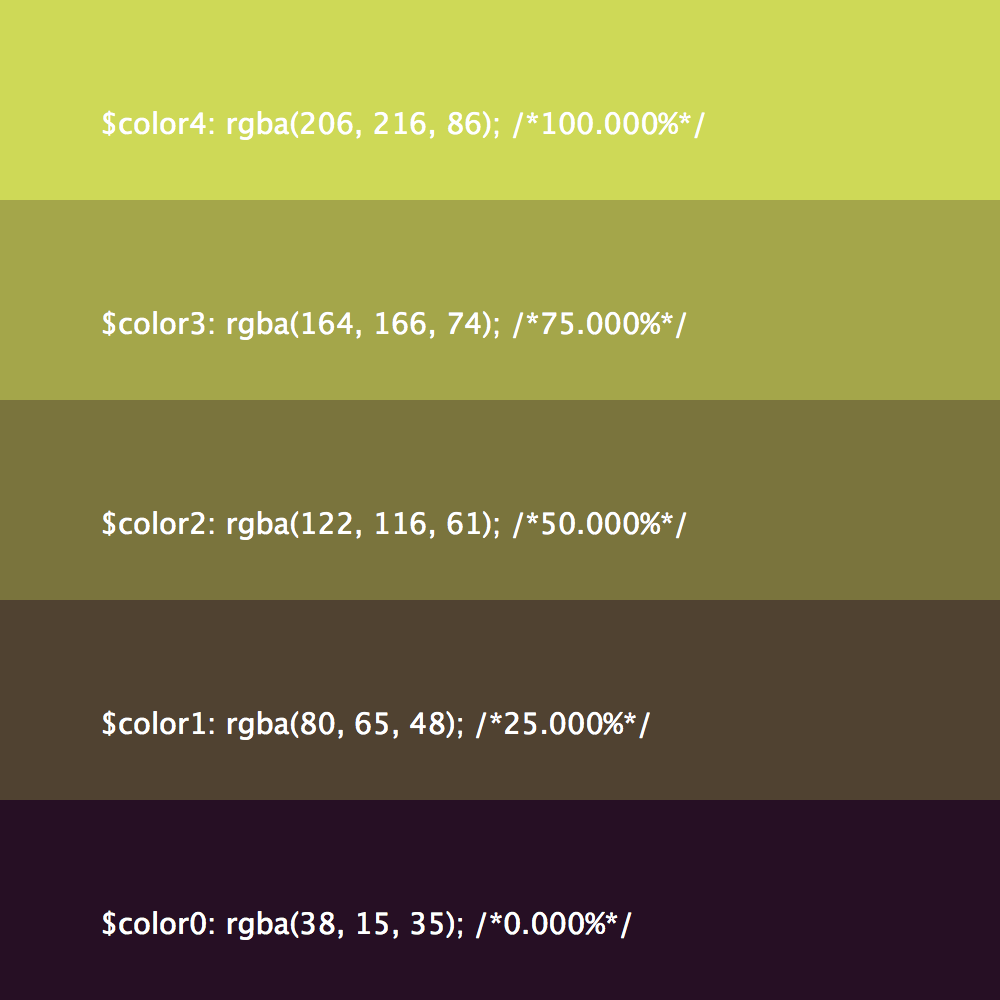
A toy for playing around with color bars with interpolating colors. Currently also prints
rgbacolors in sass syntax (or at least I think it was sass)import colorsys # calculate color bars with interpolated color steps size(1000,1000) Variable([ dict(name="steps", ui="Slider", args=dict(value=4, minValue=3, maxValue=15)), dict(name="hue", ui="Slider", args=dict(value=0.85, minValue=0, maxValue=1)), dict(name="saturation", ui="Slider", args=dict(value=0.6, minValue=0, maxValue=1)), dict(name="dark_top", ui="Slider", args=dict(value=.85, minValue=0, maxValue=1)), dict(name="dark_bottom", ui="Slider", args=dict(value=.15, minValue=0, maxValue=1)), dict(name="offset", ui="Slider", args=dict(value=.33, minValue=-.5, maxValue=.5)), ], globals()) steps = int(steps) a = colorsys.hsv_to_rgb(hue%1, saturation, dark_bottom) b = colorsys.hsv_to_rgb((hue+offset)%1, saturation, dark_top) def ip(a,b,f): return a+f*(b-a) h = height()/(steps+1) fontSize(min(29, .5*h)) for i in range(steps+1): f = i/steps c = (ip(a[0],b[0],f), ip(a[1],b[1],f), ip(a[2],b[2],f)) v = tuple([int(v*255) for v in c]) fill(*c) rect(0, 0, width(), h) fill(1,1,1) t = "$color%d: rgba%s; /*%3.3f%%*/" %(i, str(v), f*100) text(t, (100, .33*h)) translate(0, h) print(t) saveImage("calculateColorScale.png")